Just a few weeks ago, we unveiled our latest solution designed to track your autoclavable assets. This innovation allows you to closely monitor high-temperature cycles with unprecedented accuracy, enabling you to evaluate your assets’ overall efficiency. What are the impacts on S-HUB and your analytics reports? Ready, steady, go!
What’s up on S-HUB? A brand new ’Hot’ asset details view
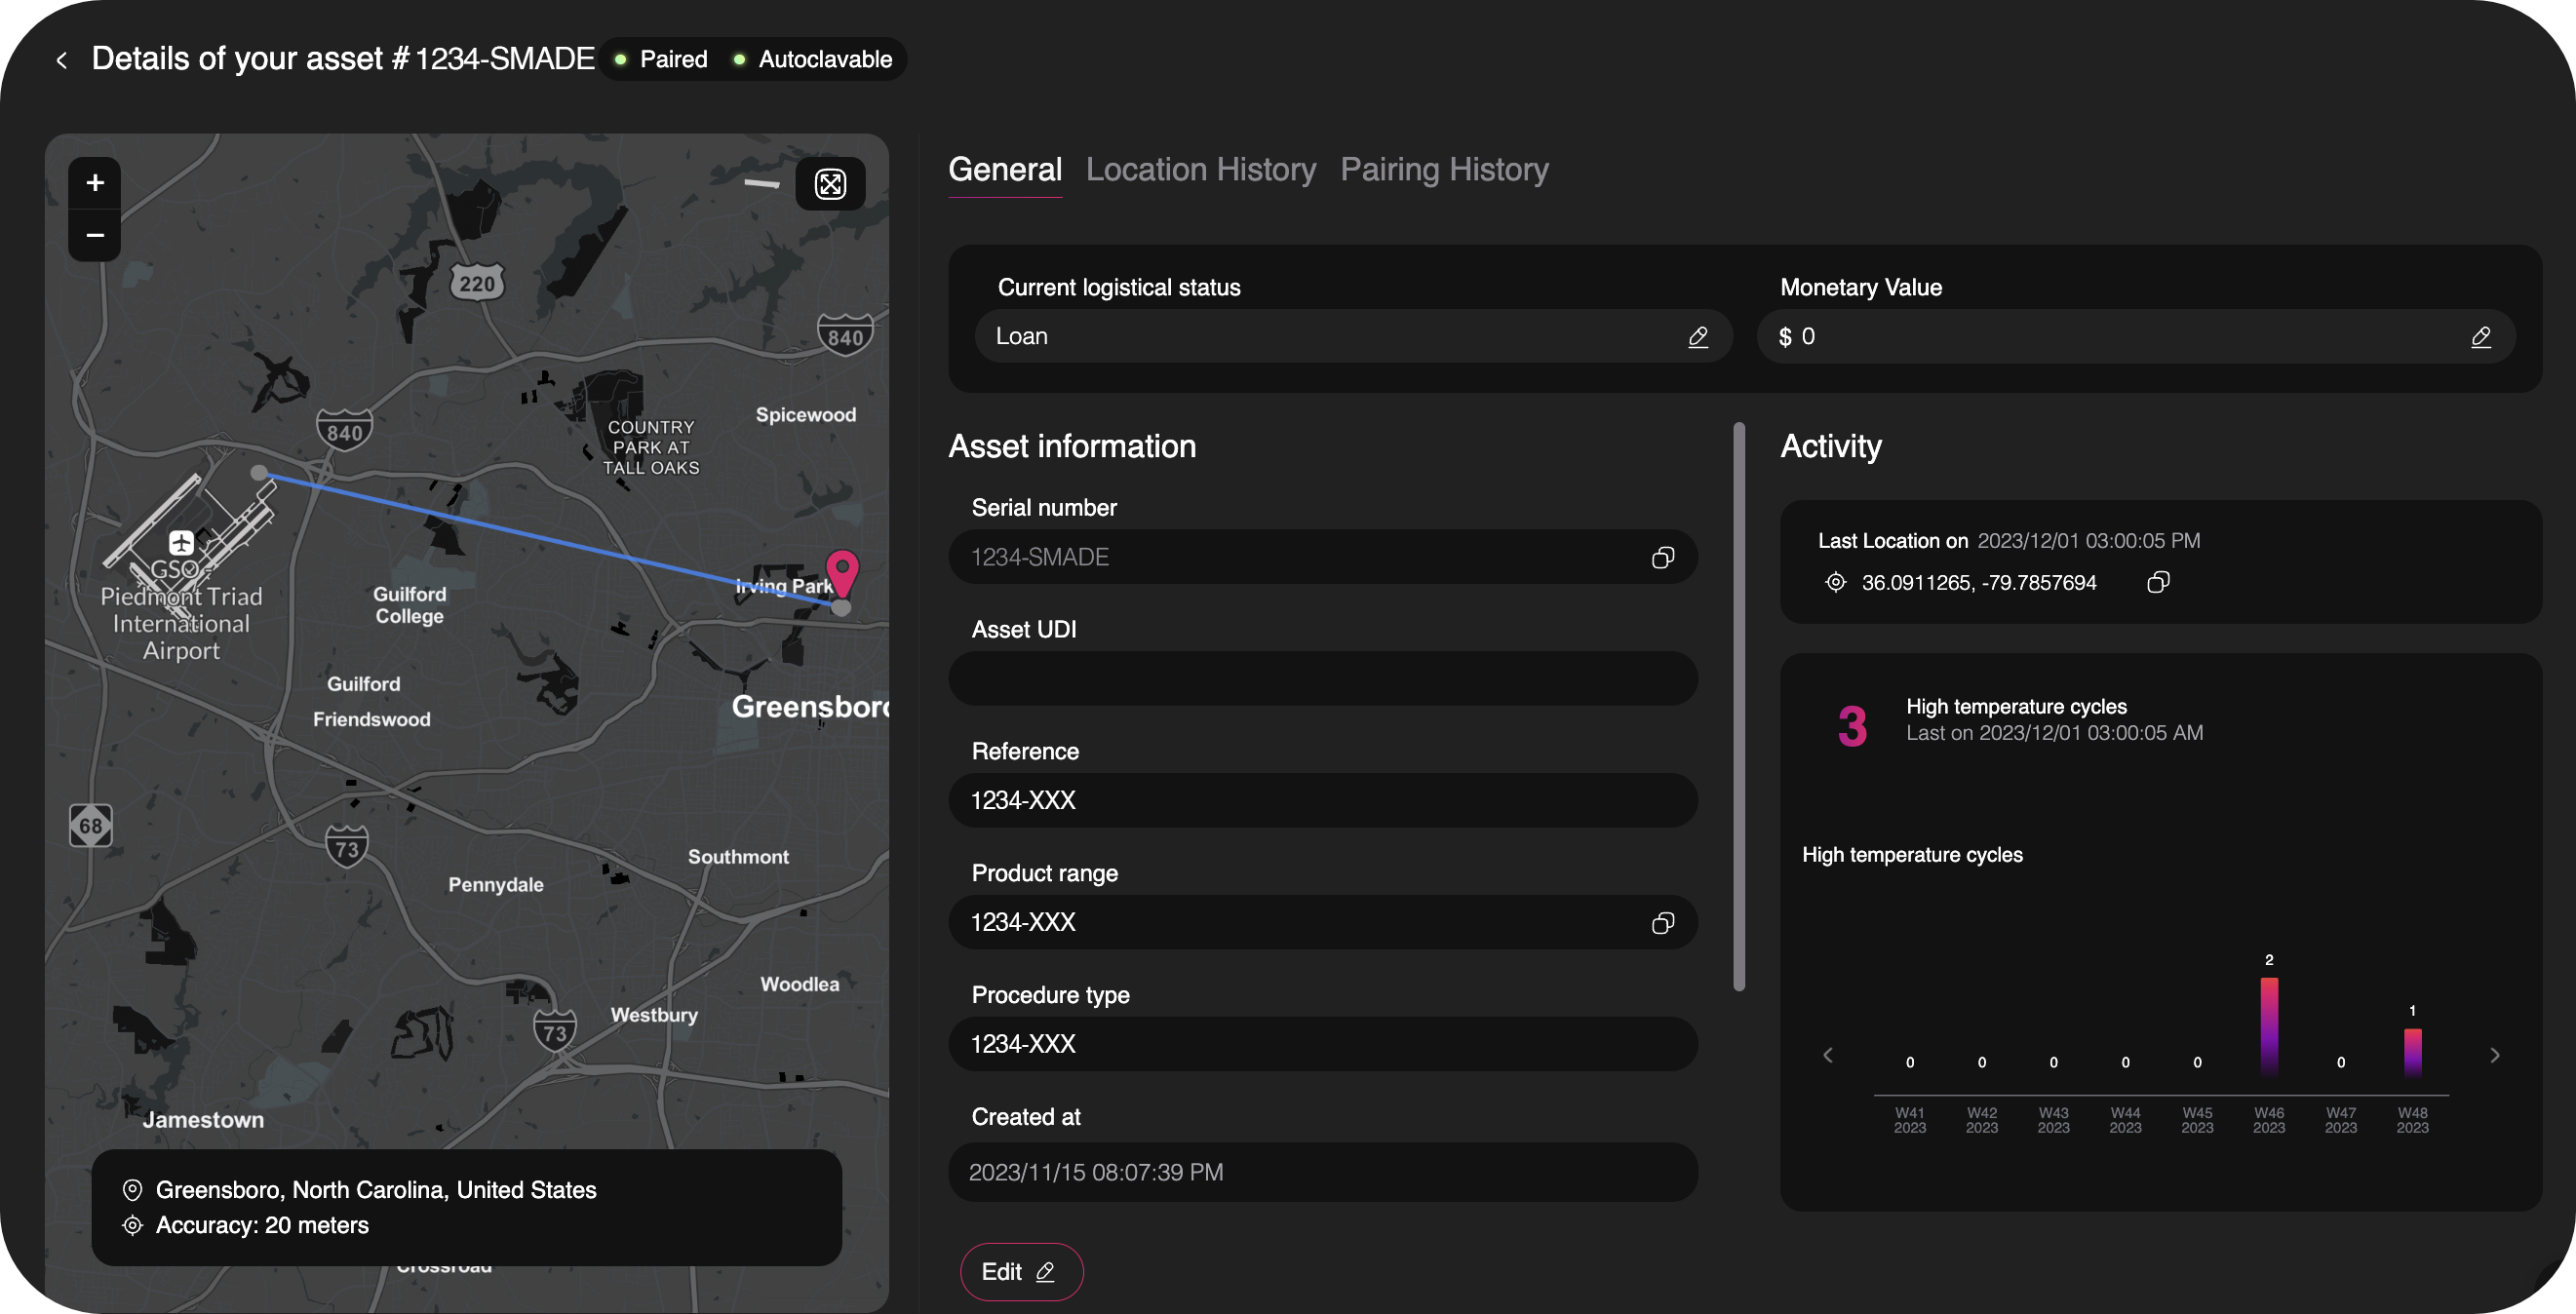
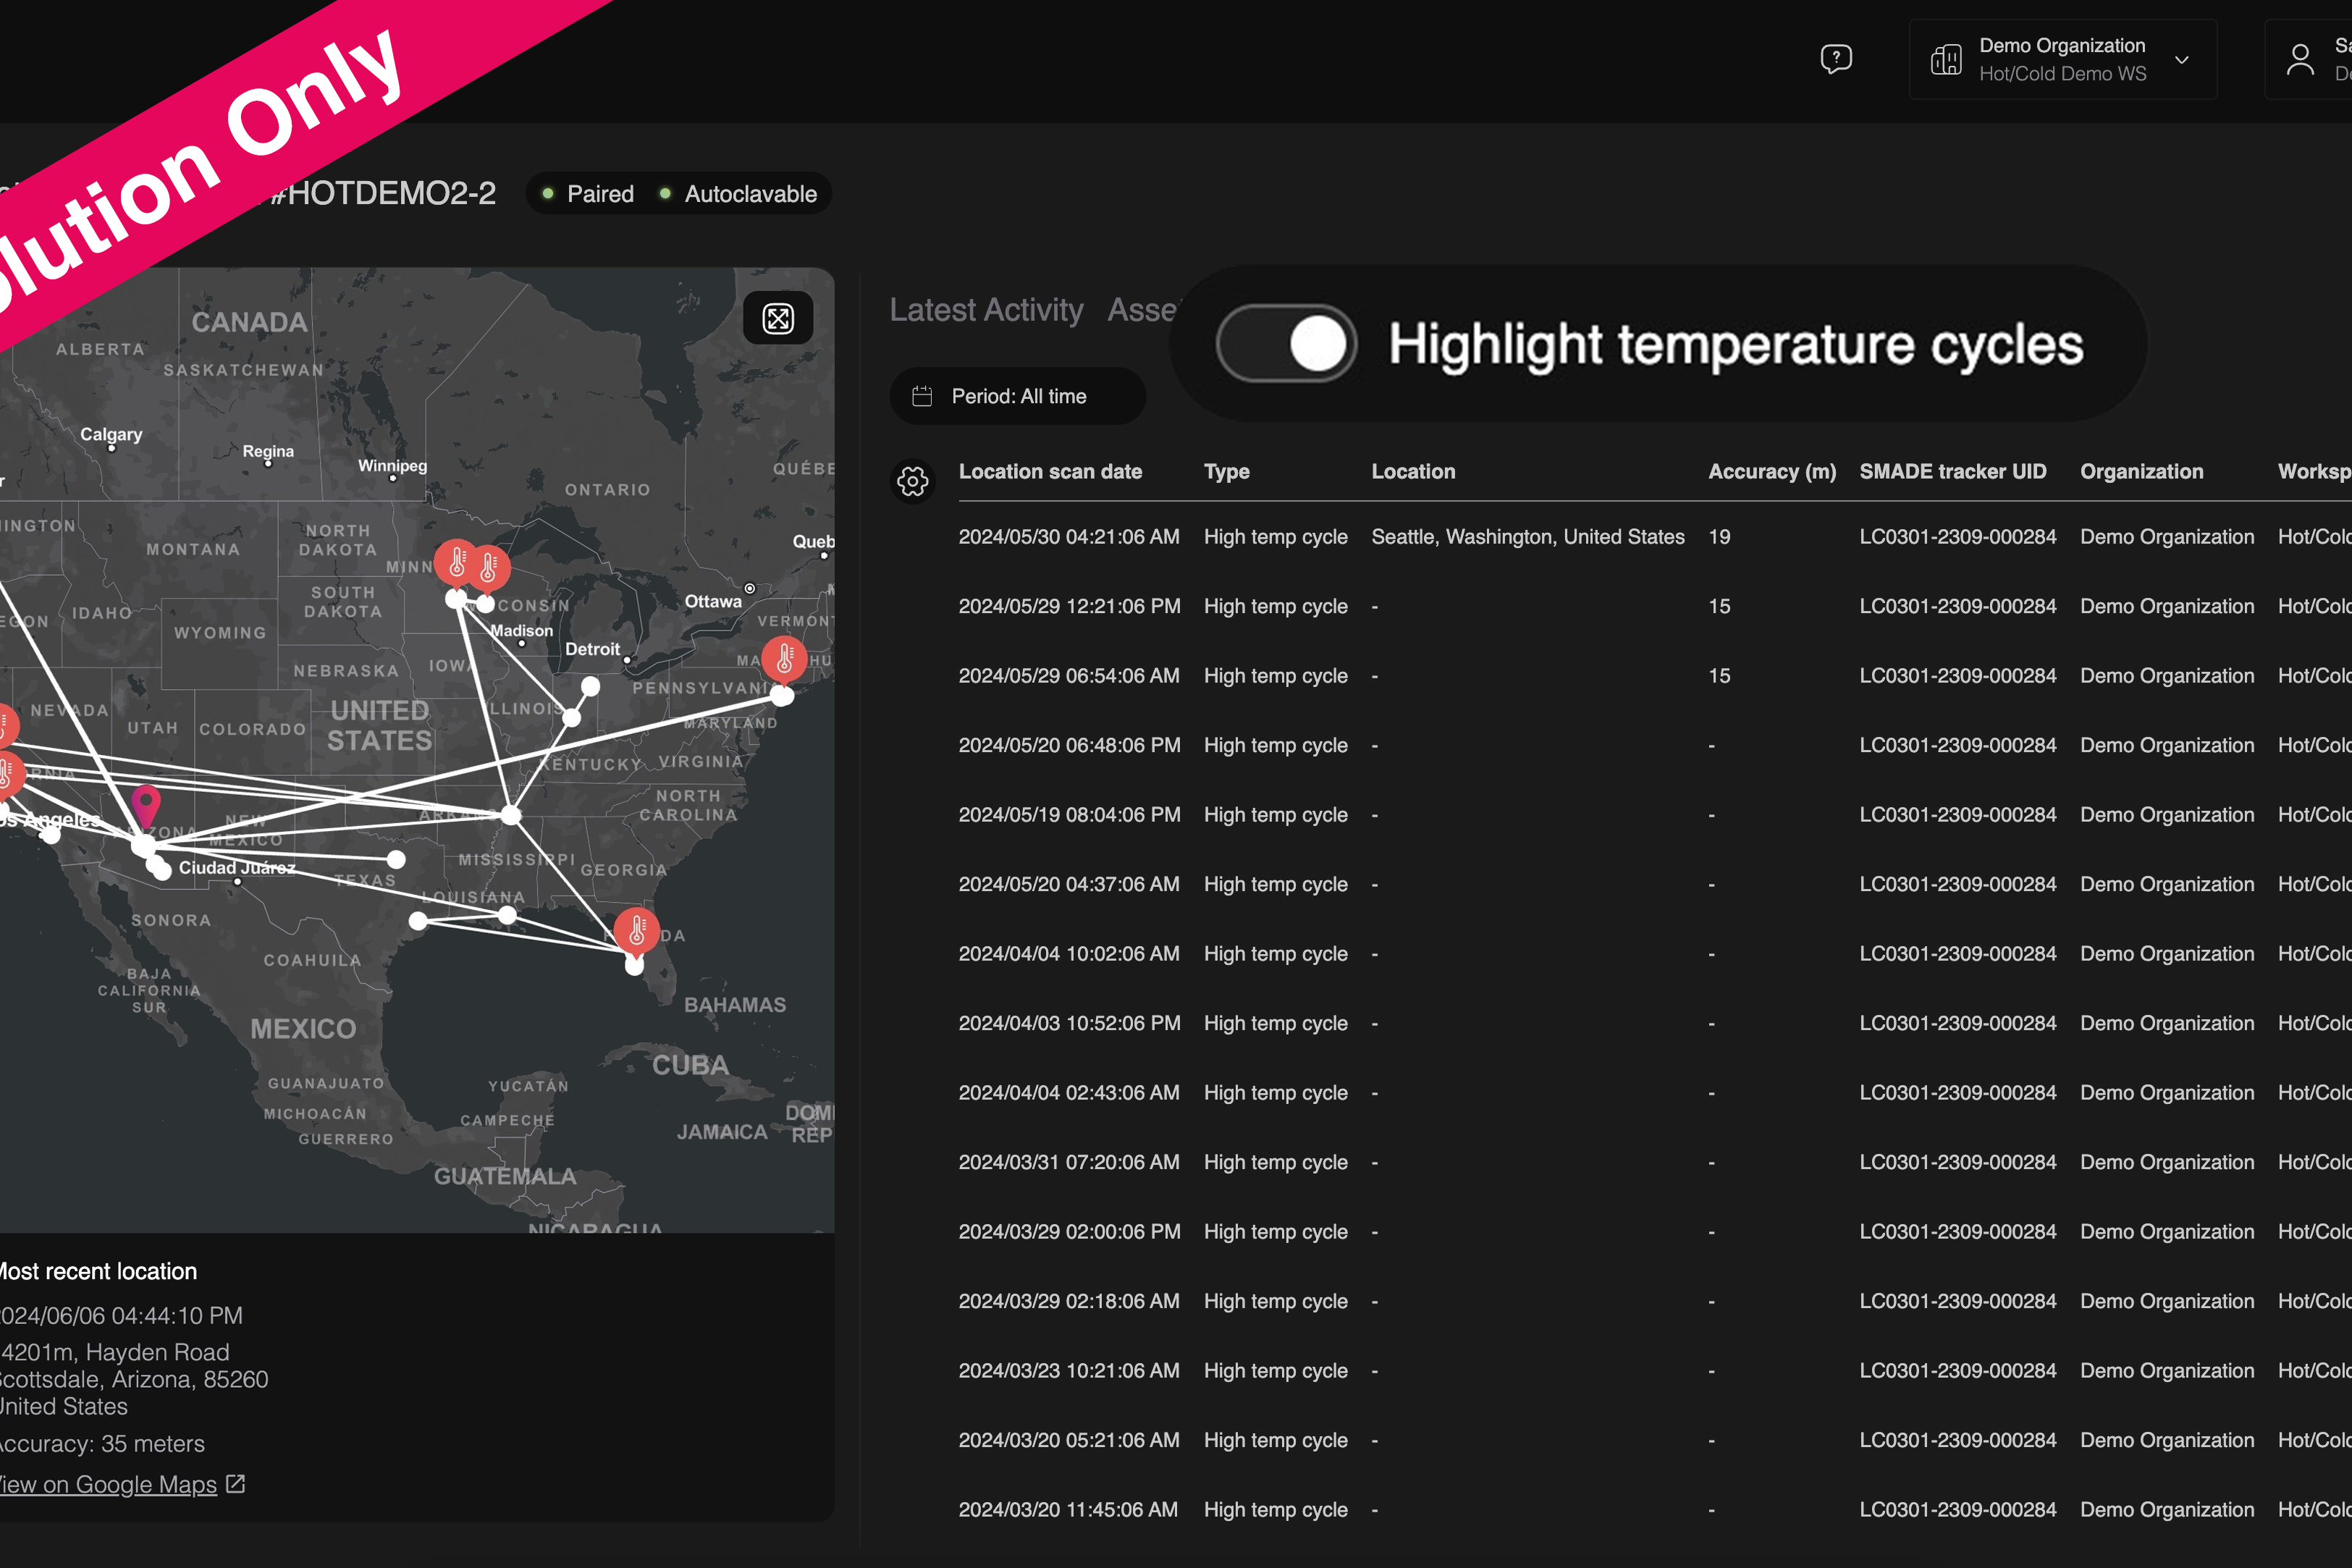
Ever felt like your autoclavable assets were veiled in mystery? Not anymore! S-HUB’s asset details view reveals unprecedented insights into their activity, turning invisible data into valuable actions!
Visibility fuels insights, insights empower, empowerment drives decision-making
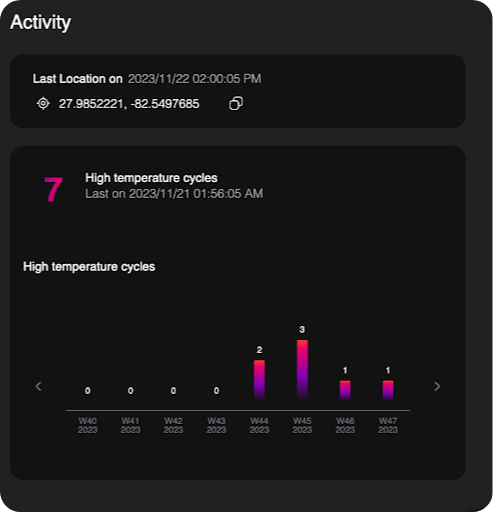
Explore the power of the hot analytics freshly added to the asset details view in S-HUB , your trusted companion in overseeing high-temperature cycles. Observe the activity of your assets undergoing sterilization. If you notice a break over several days, the week-by-week bar chart becomes a goldmine of data. It enables you to easily pinpoint your assets efficiency and empowers you to make strategic decisions that will take your asset management to the next level.
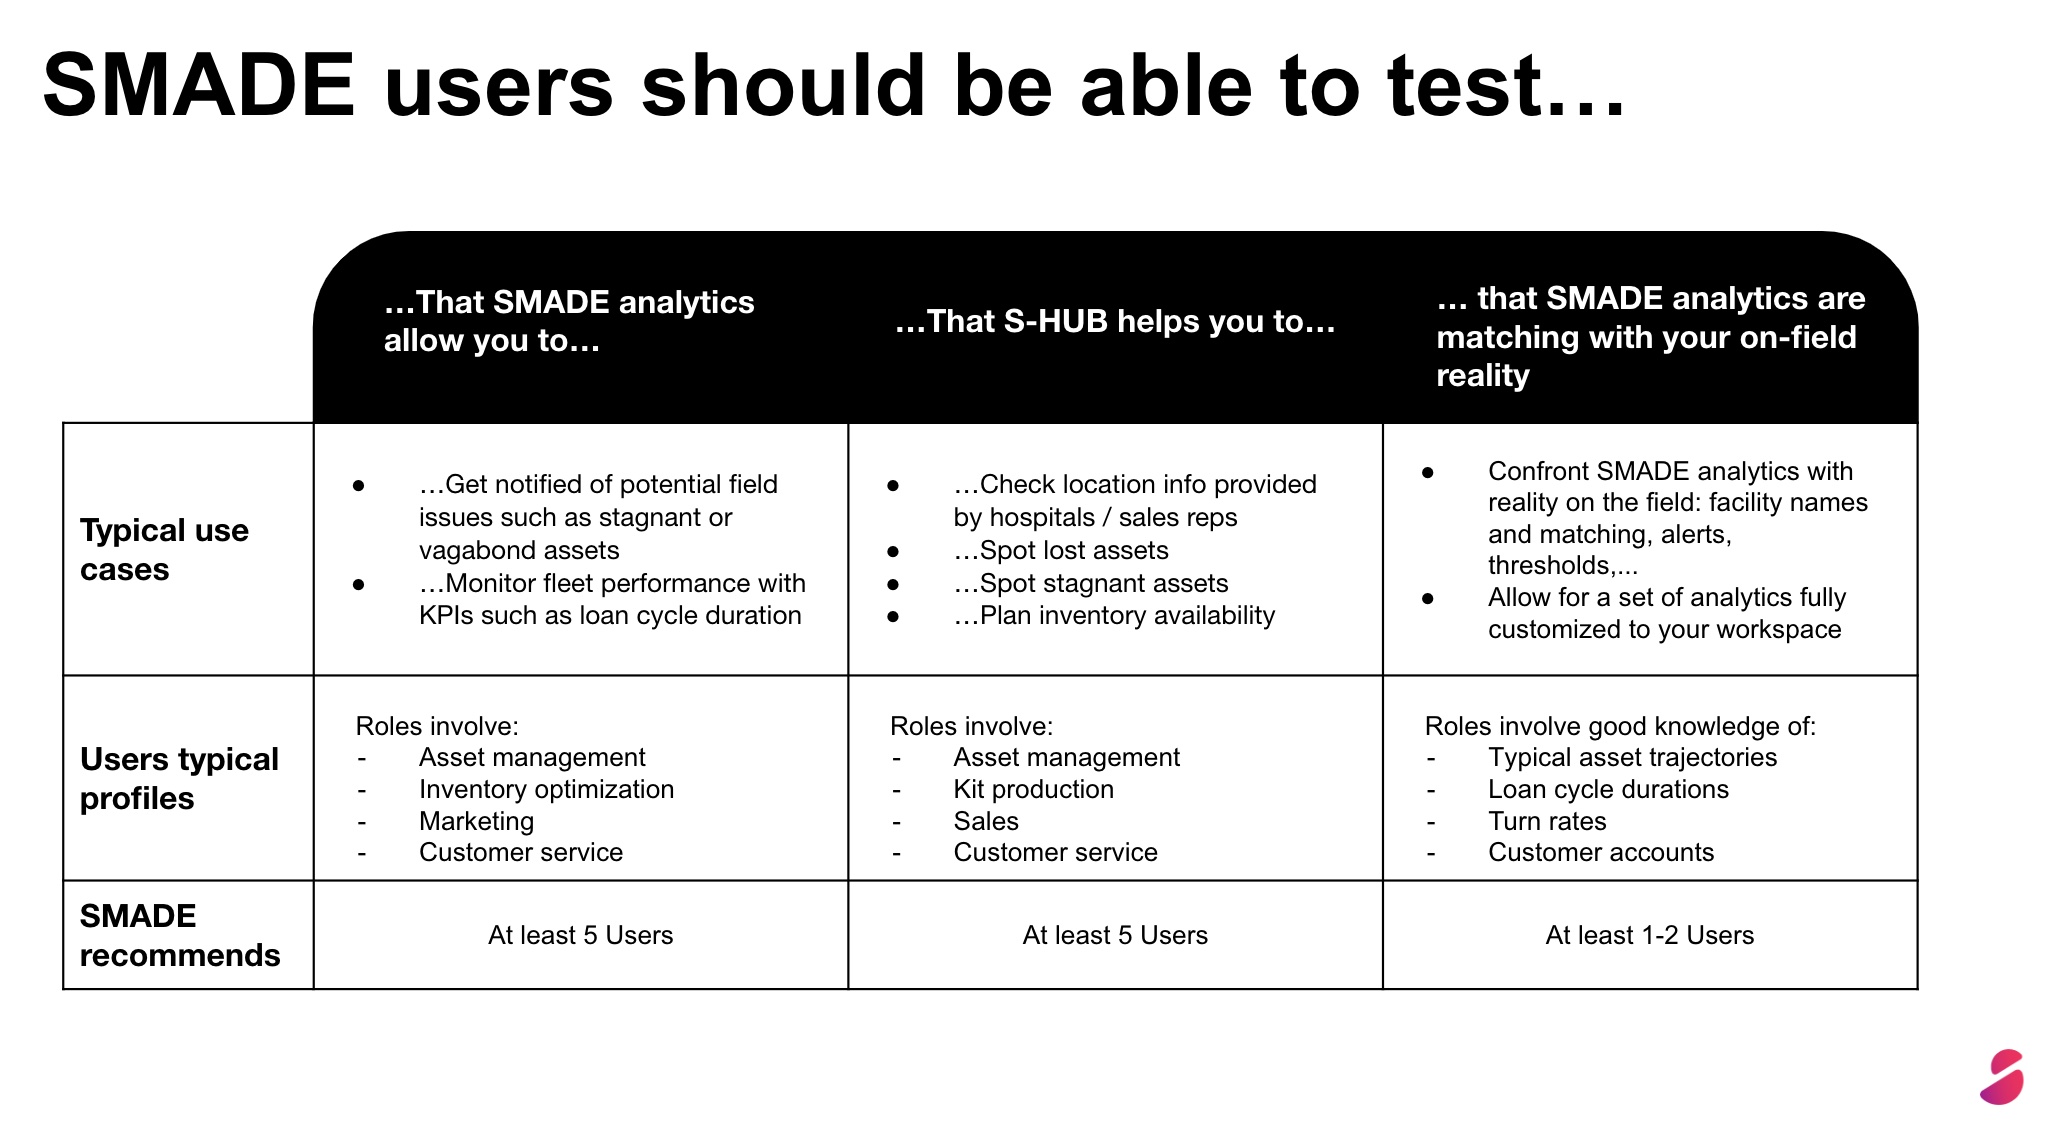
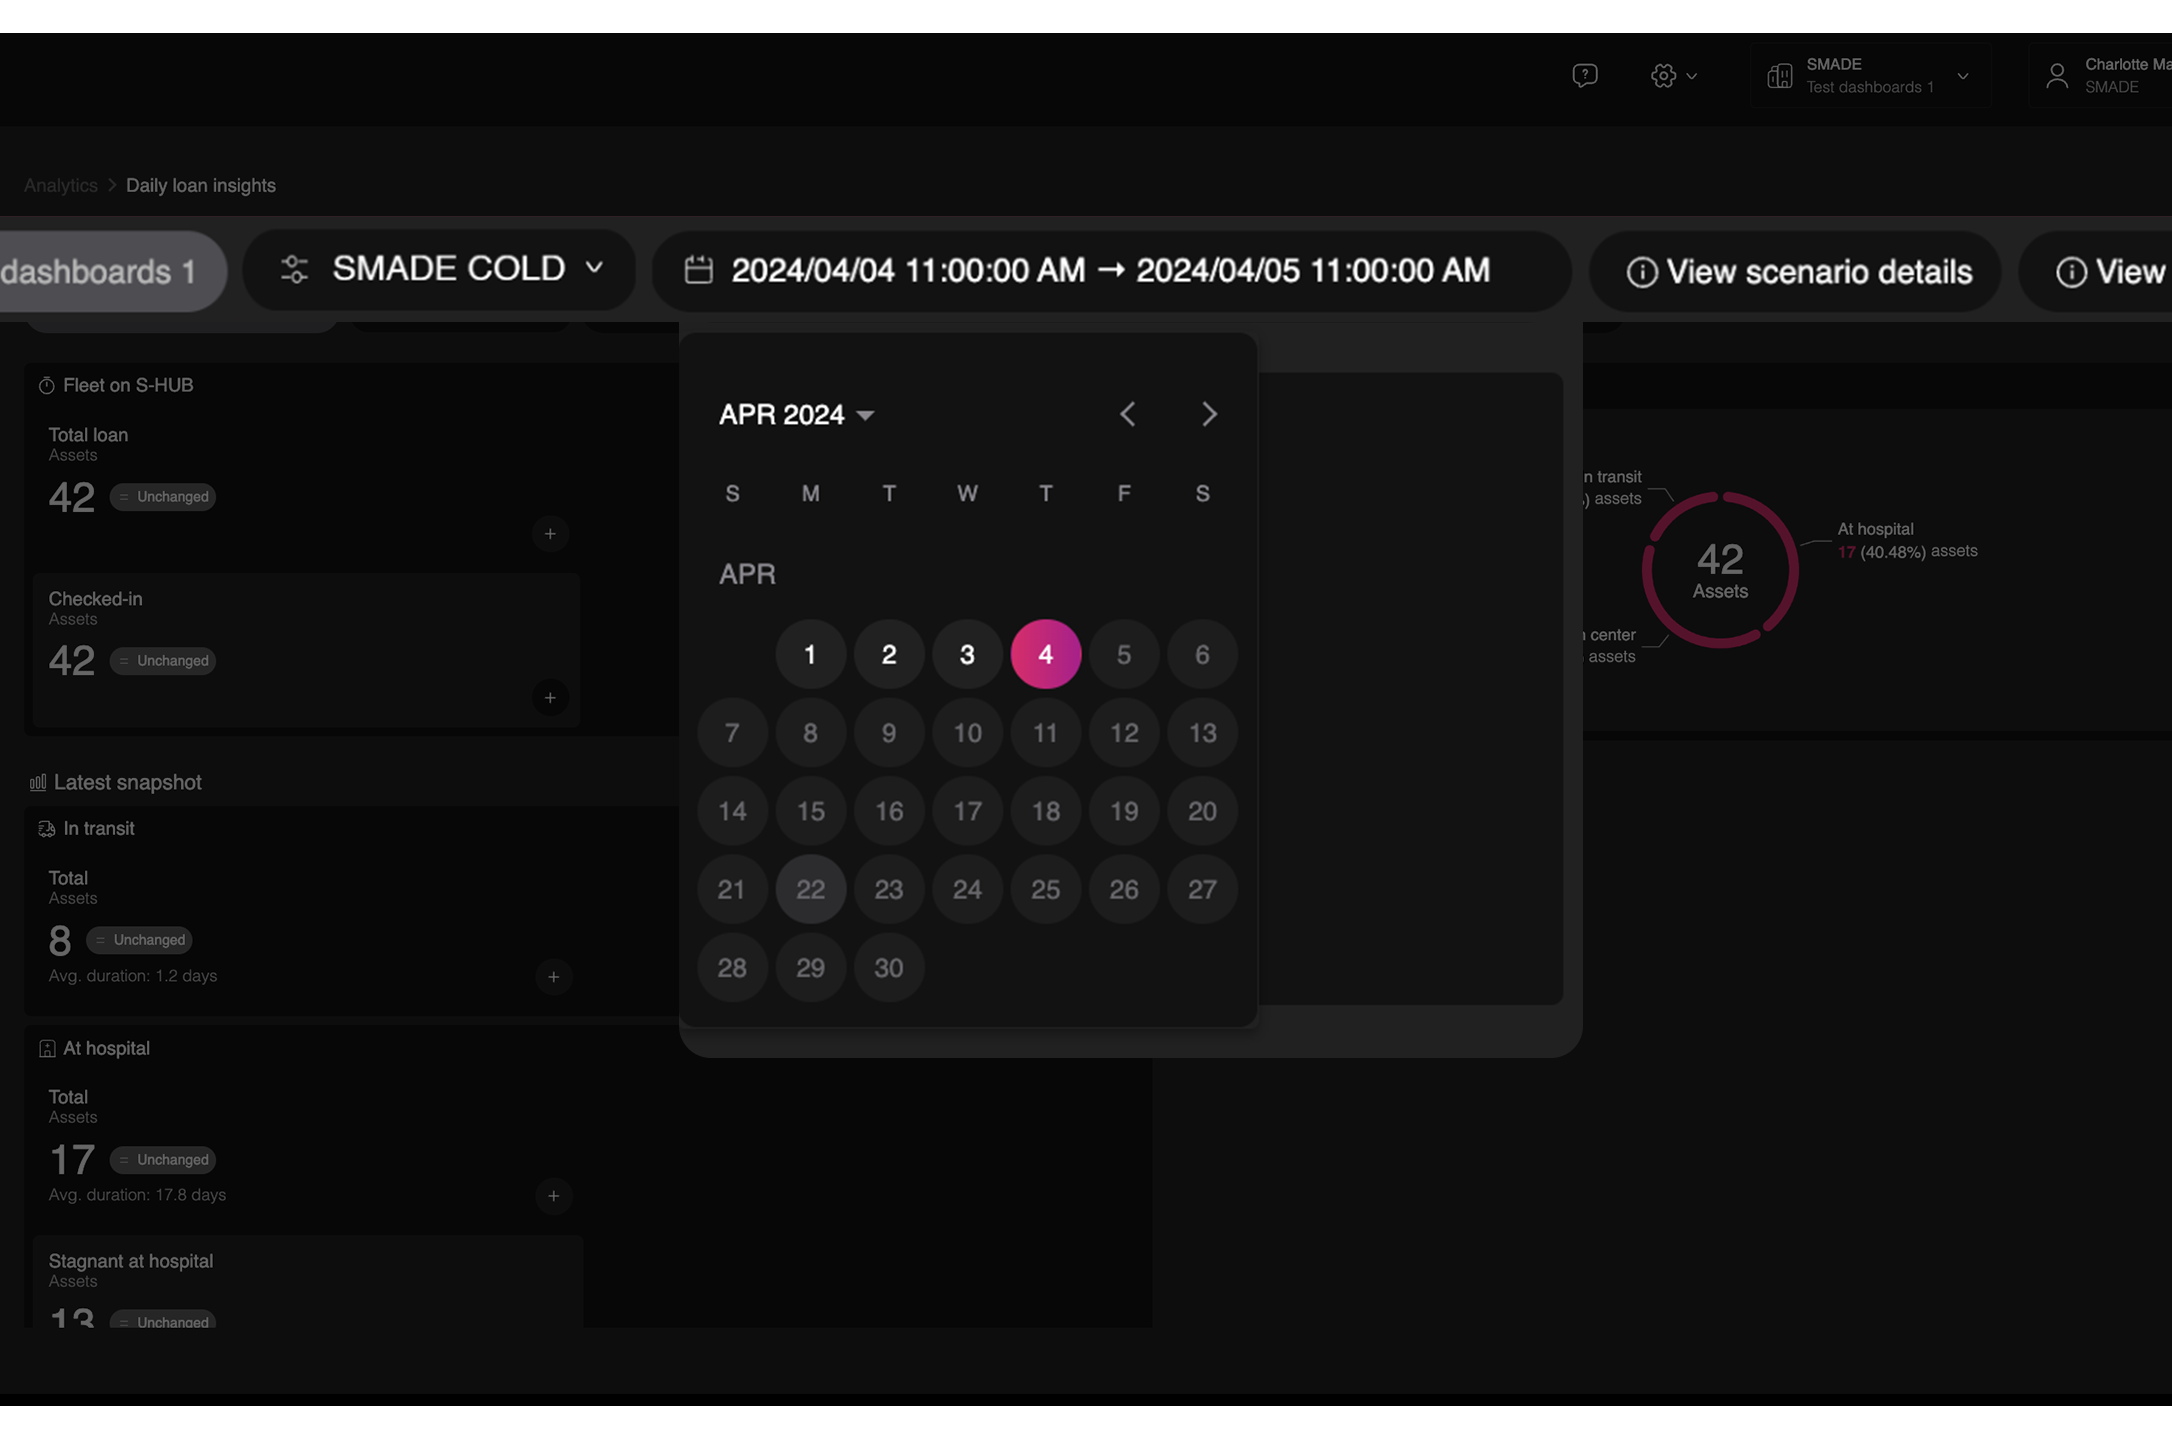
But wait… there’s more! Your Analytics allow you to keep track of your autoclavable assets and optimize your fleet performance
Thanks to our Daily, Weekly, and Monthly Analytics, monitor your assets behavior and analyze their efficiency:
- stagnant
- lost-in-transit
- fugitive
- late returns
- inactive
- silent
- in-field trasfers
- non operational days
- number of loan cycles and their duration
Not a Hot Tracking Solution user yet? Check out how SMADE will change your inventory management game.
Spread the word !
Other posts
Uncover hidden asset inefficiencies with the New High-Temp Cycles Highlight feature
Back to solution updates At SMADE, we are dedicated to continuously improving your experience with our platform. Here are the latest enhancements,…
Streamlined fleet monitoring upgrades on analytics dashboards and asset details view!
Back to solution updates Dear users, We are thrilled to announce some exciting new features that have just been launched on S-HUB! These enhancements…
If you love to write about smart healthcare, fill this form to become a writer for ‘In Your hands’.