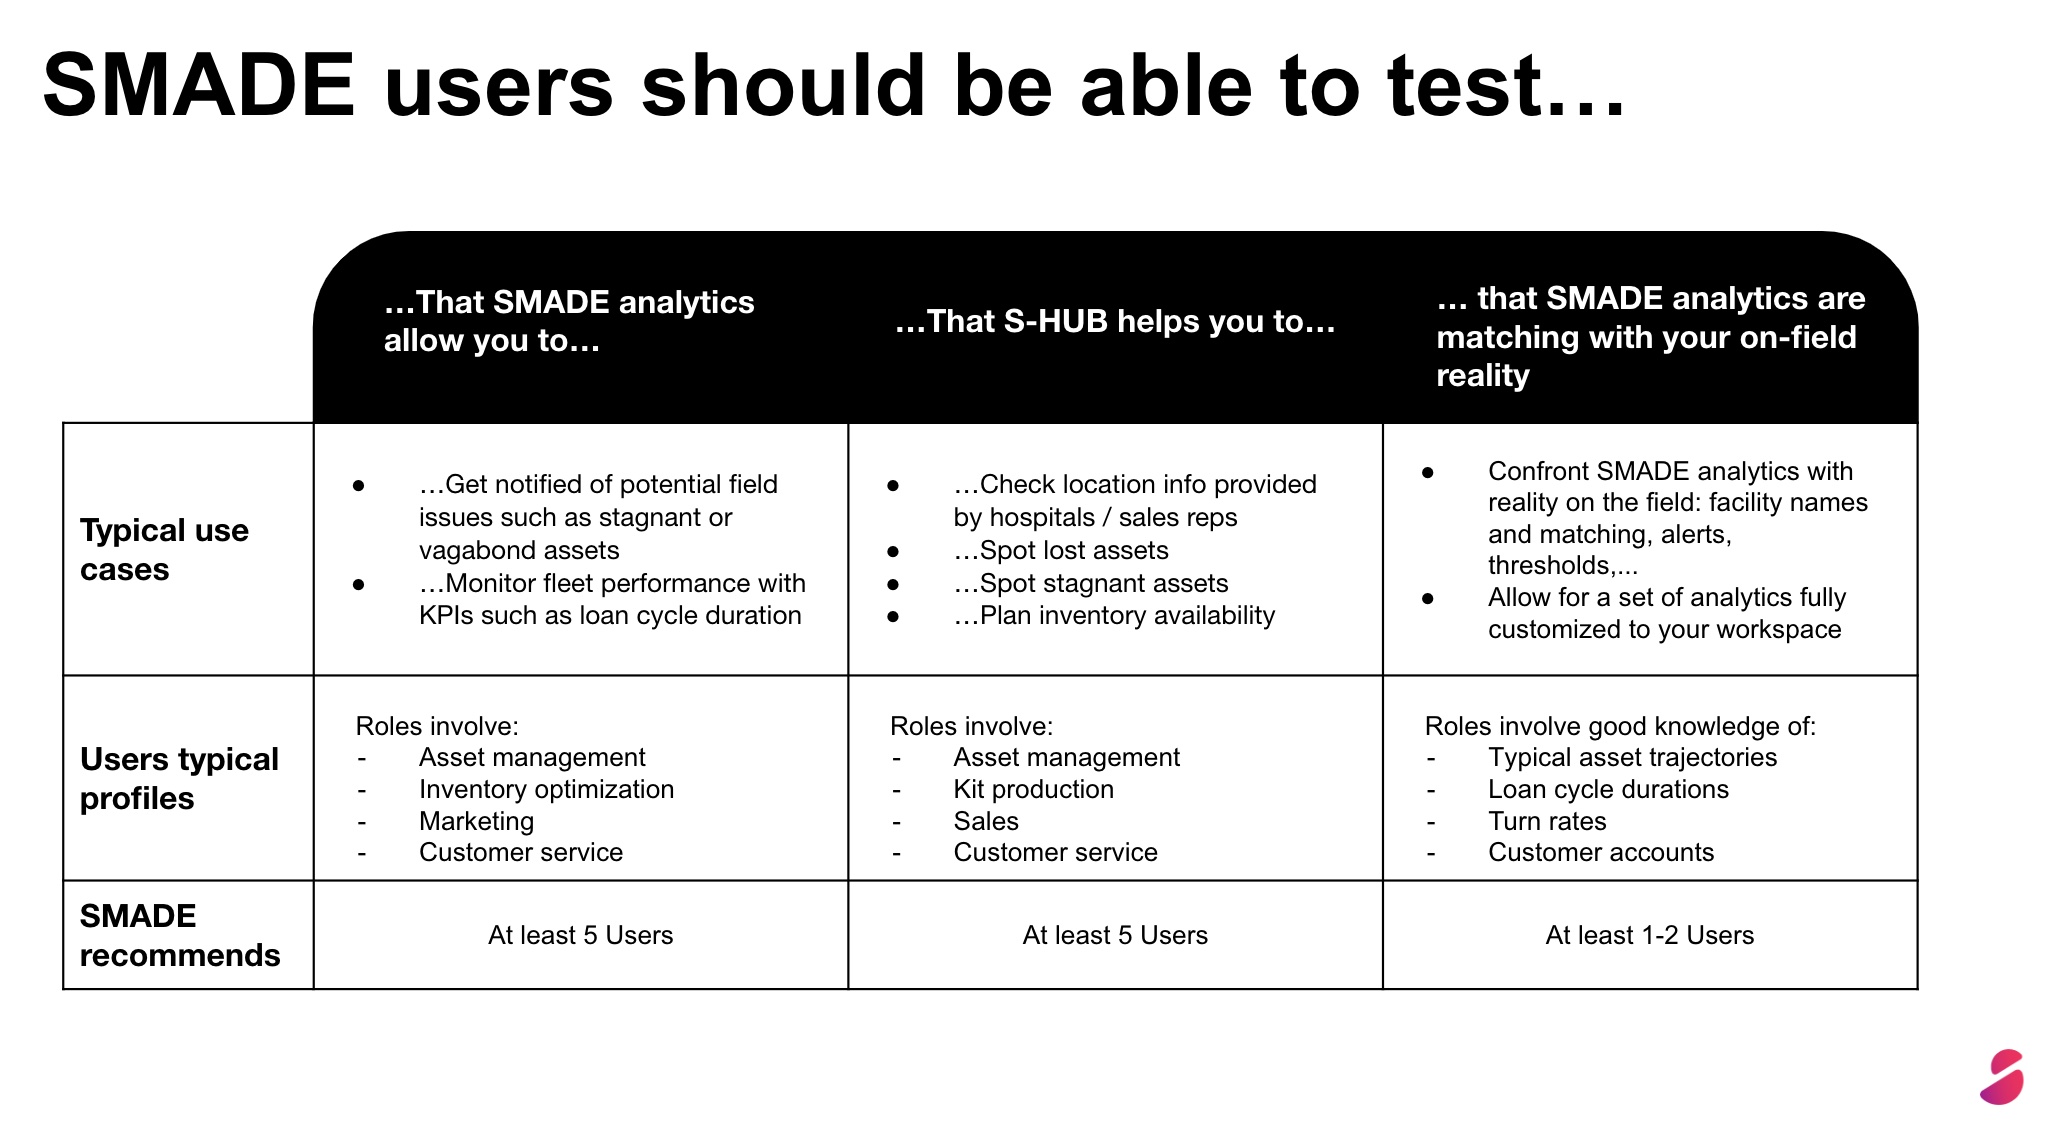
Dear S-HUB users!
We are excited to introduce you to a key feature for tracking and optimizing the performance of your assets: Scorecards.
They provide a quick and concise visualization of essential information related to the behavior or status of your assets that should alert you.
What is a scorecard? 📊
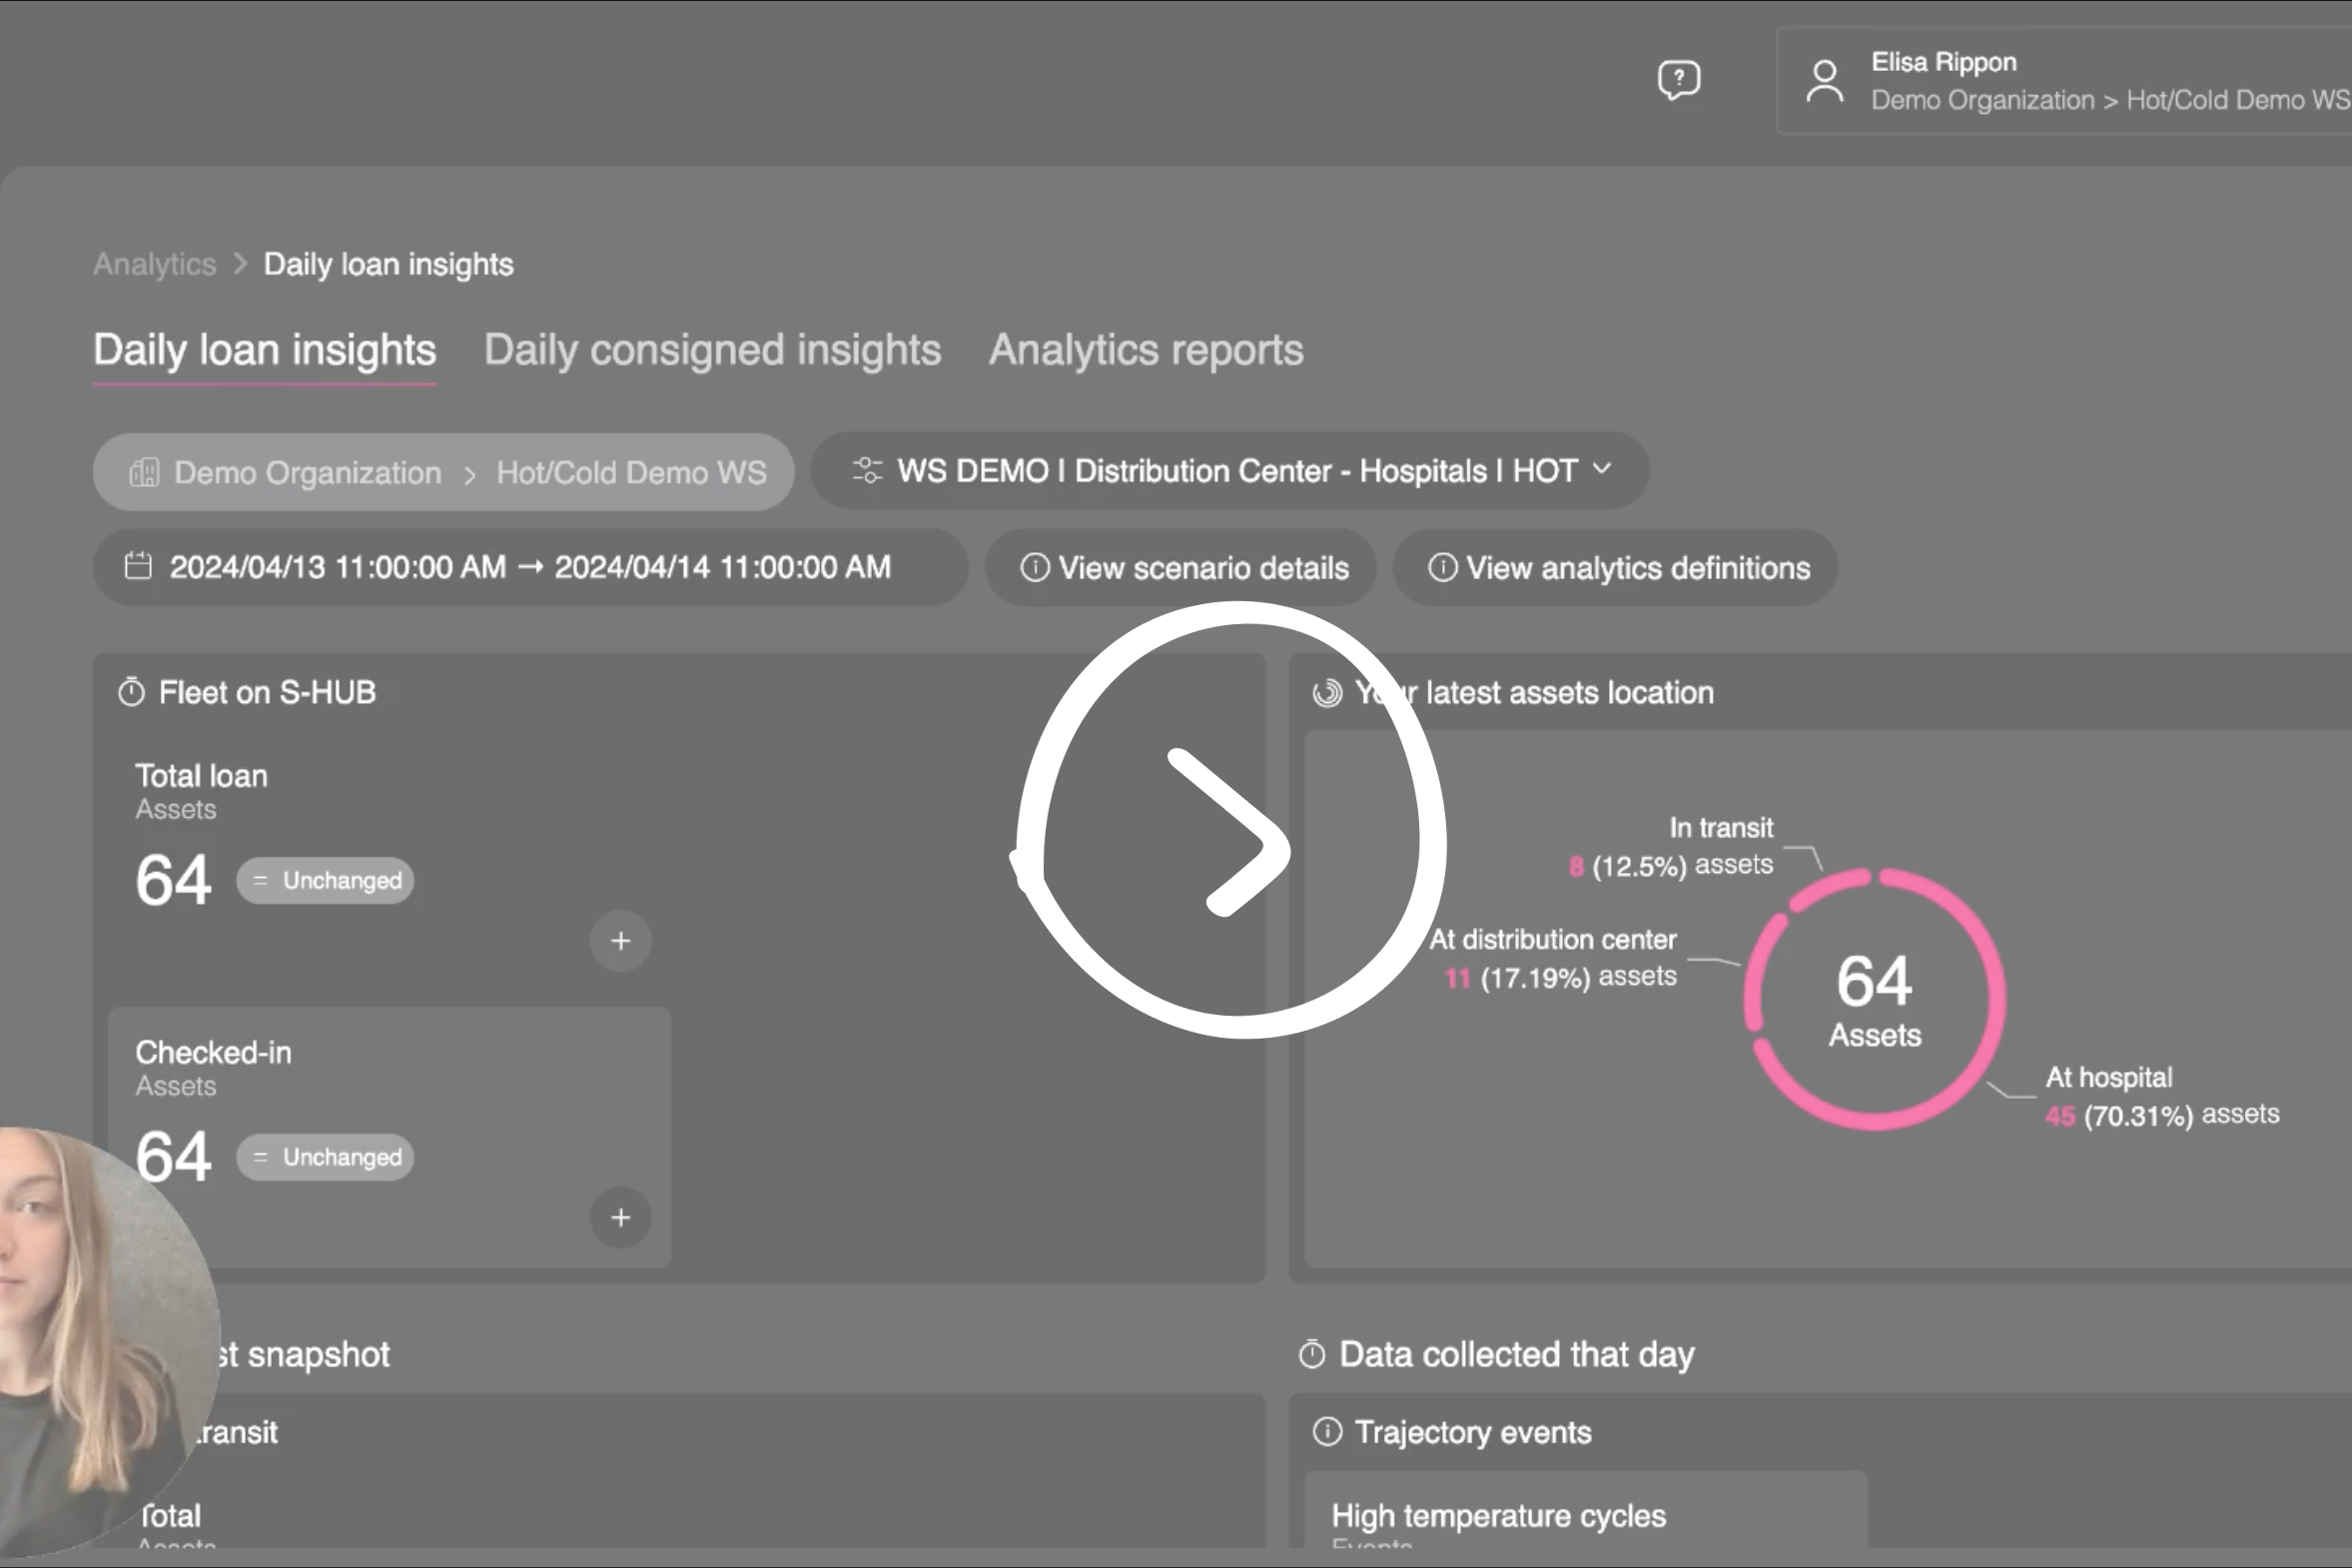
A scorecard is a tool that allows you to visualize alerts on your dashboards in a clear and concise manner. Here is what each scorecard contains:
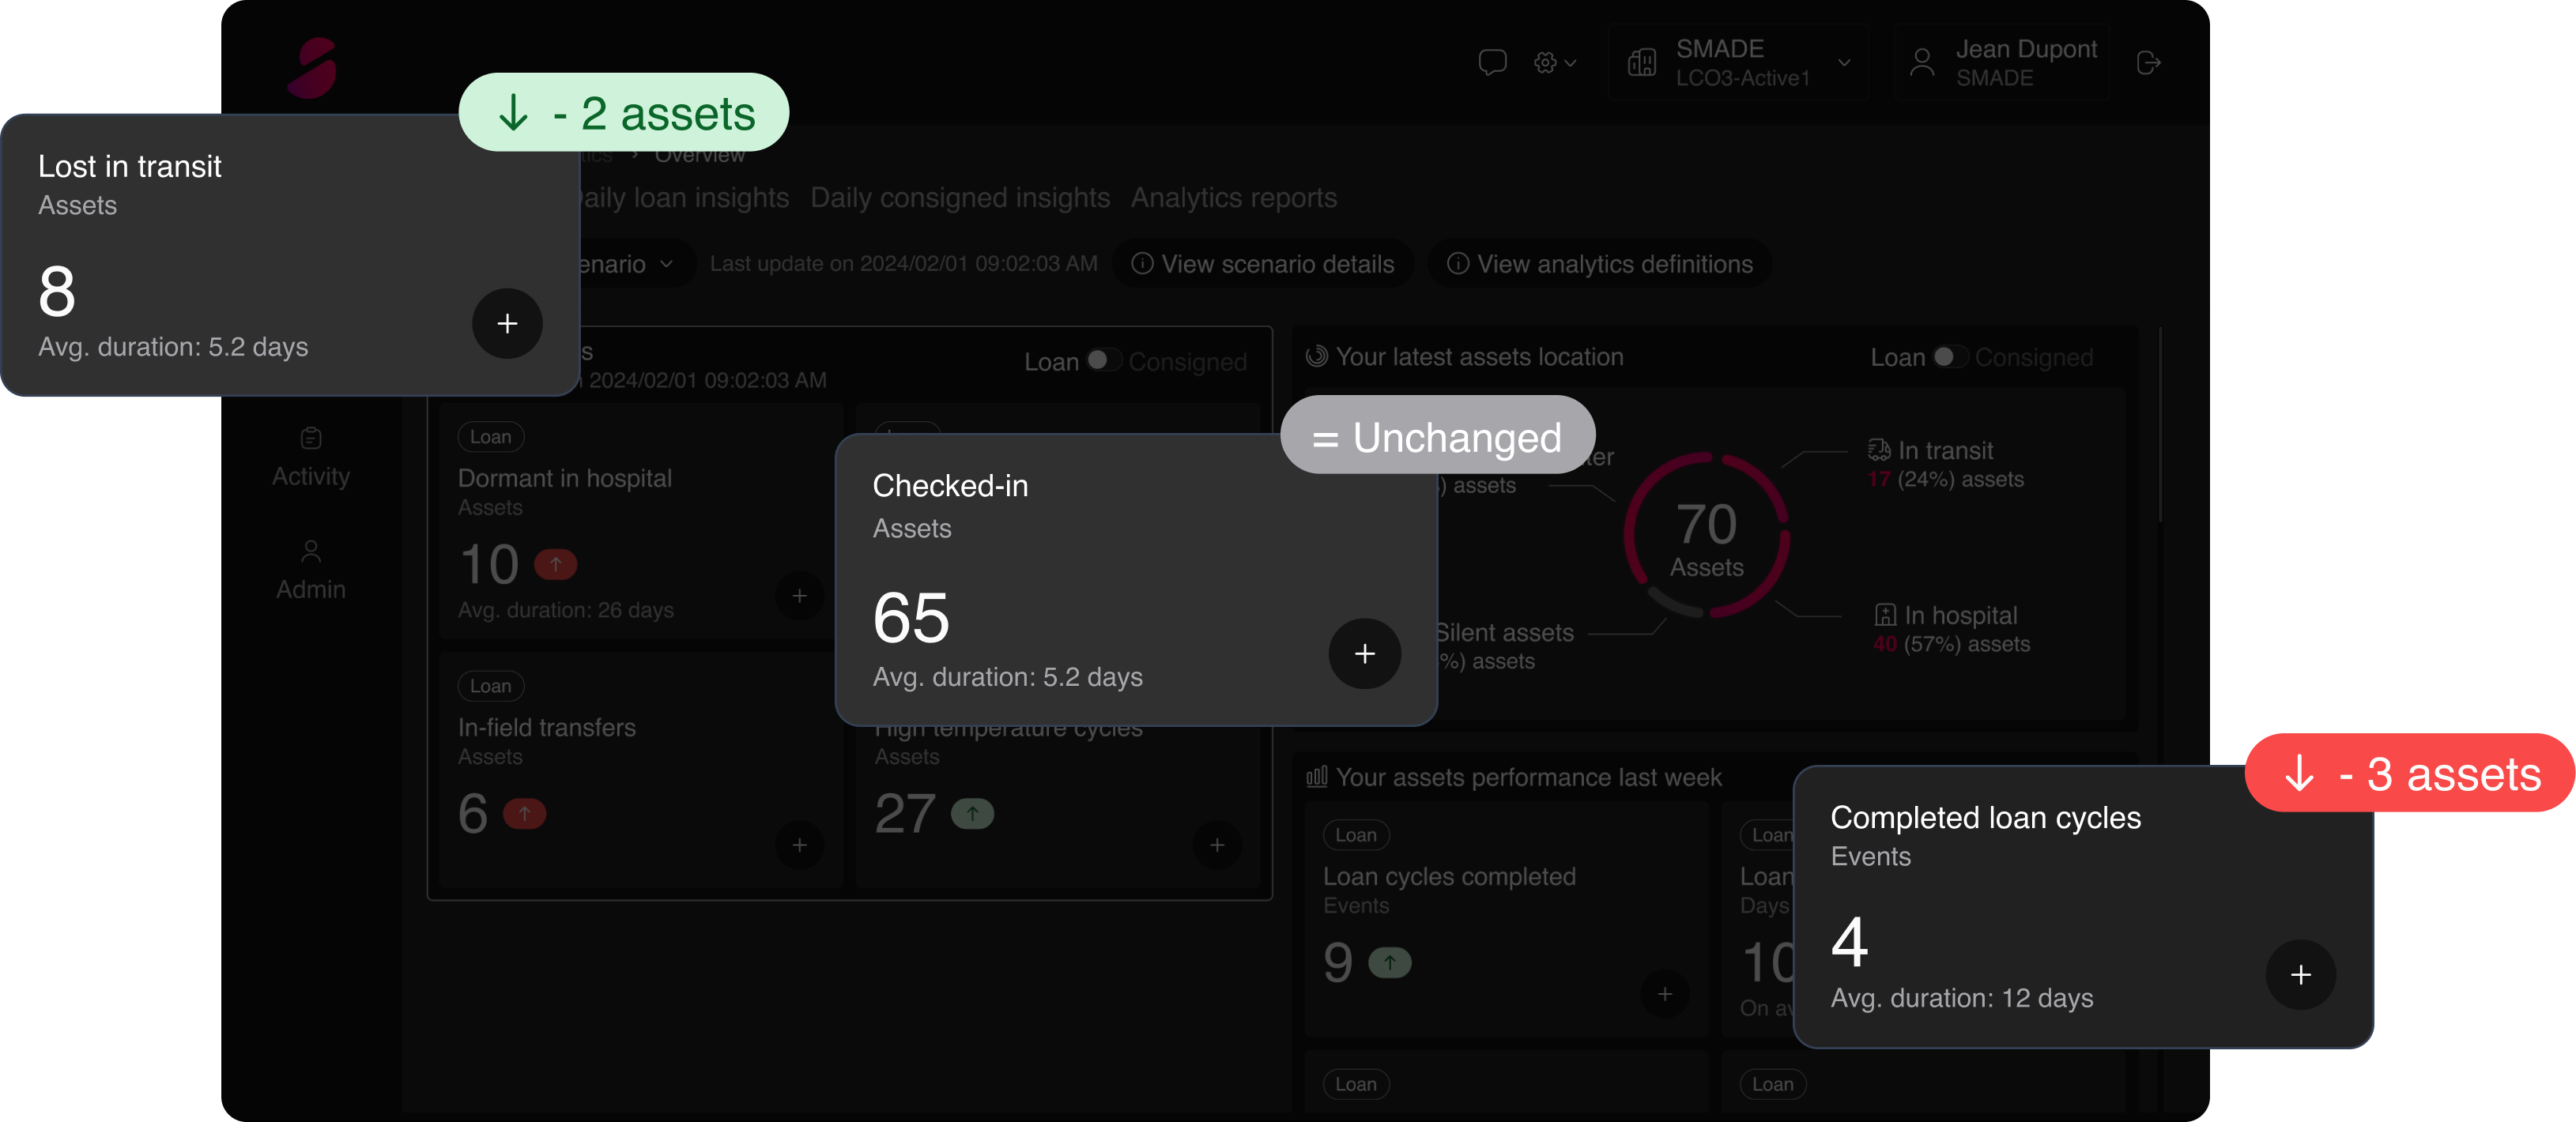
- Title of the alert observed: checked-in, silent, lost-in-transit, stagnant, dormant, fugitives…
- Monitoring unit: This can be the number of assets concerned by a status/behavior or the number of events: high-temp cycles (for hot fleet only), completed loan cycles (for loaned assets), in-field transfers.
Trend since the previous day’s data 📊
- Green flag: The trend is improving, indicating a positive situation.
- Red flag: The trend is worsening, requiring corrective action.
- Gray flag: The trend is neutral or unchanged, having no impact on the performance of your fleet.
Each flag includes 👇
- An upward or downward arrow indicating the increase or decrease in the number of assets or events concerned.
- The number of additional or fewer assets/events observed since the previous day.
- Average duration of the status, behavior, or events reported: Expressed in the number of days.
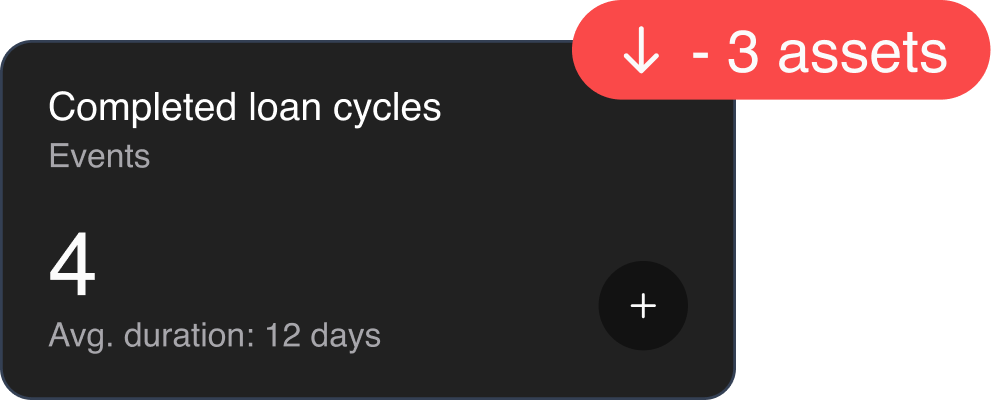
Note 🗒️
An upward arrow with a green flag is positive (e.g., a decrease in lost-in-transit assets). Conversely, a red flag should alert you immediately.
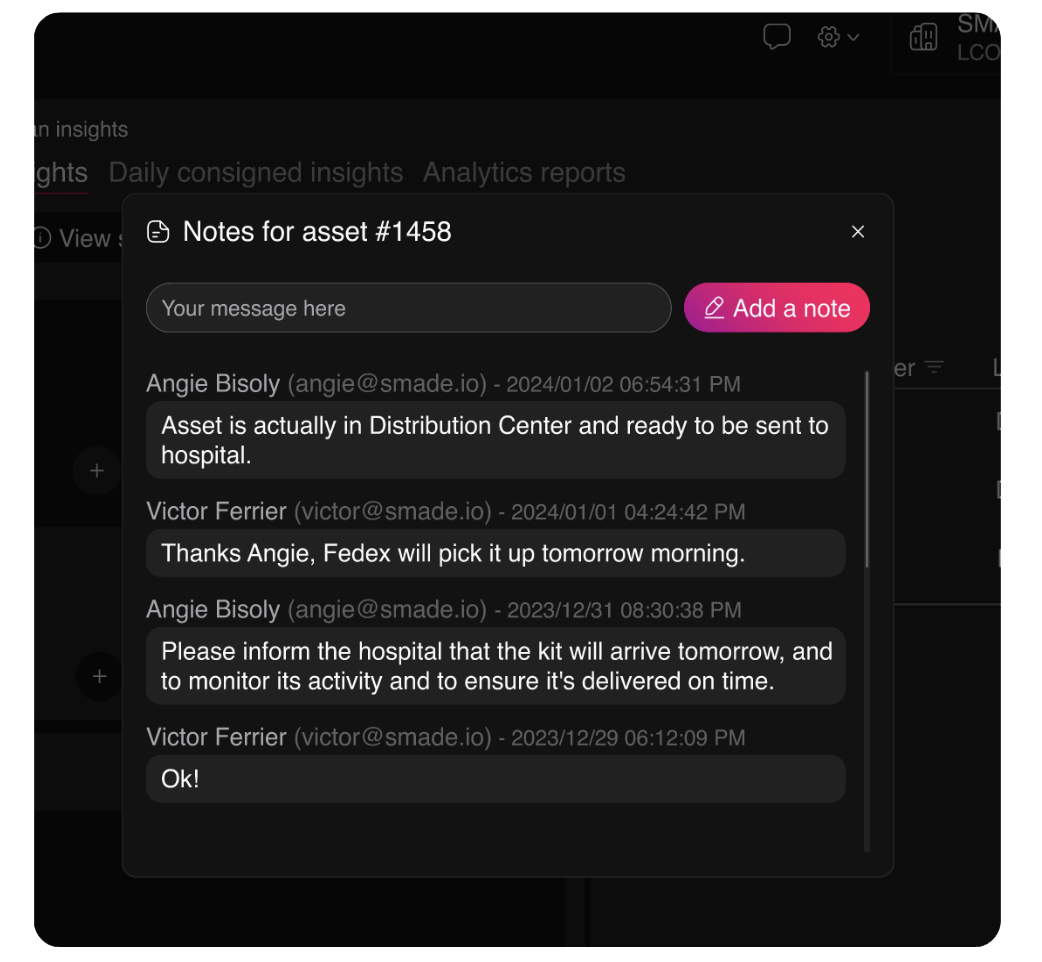
Pro Tip 🤩
Each scorecard is clickable! By clicking, you can access a detailed table of the concerned assets. From there, you can navigate to the asset detail view, share asset location details, and/or take valuable notes to enrich the behavior history of your fleet.
We hope these explanations help you make the most of your analytics dashboards.
For any questions or assistance, please don’t hesitate to contact us.
Happy analyzing!
Spread the word !
Other posts
Pair and unpair your assets on S-HUB
Back to solution updateshttps://www.smade.io/wp-content/uploads/2024/09/How-to-create-and-pair-your-asset-.mp4
Unlock the power of collaboration with S-HUB “Notes” Feature!
Back to solution updatesHello SMADE Users, We’re excited to share another valuable SMADE Tip to help you optimize your fleet management. Today,…
If you love to write about smart healthcare, fill this form to become a writer for ‘In Your hands’.