S-HUB Platform
Full visibility.Zero guesswork.Total control.
S-HUB centralizes your fleet visibility, operational alerts, performance KPIs, and team collaboration — in one powerful platform.
Locate
See every asset.Understand the context.Act with clarity.
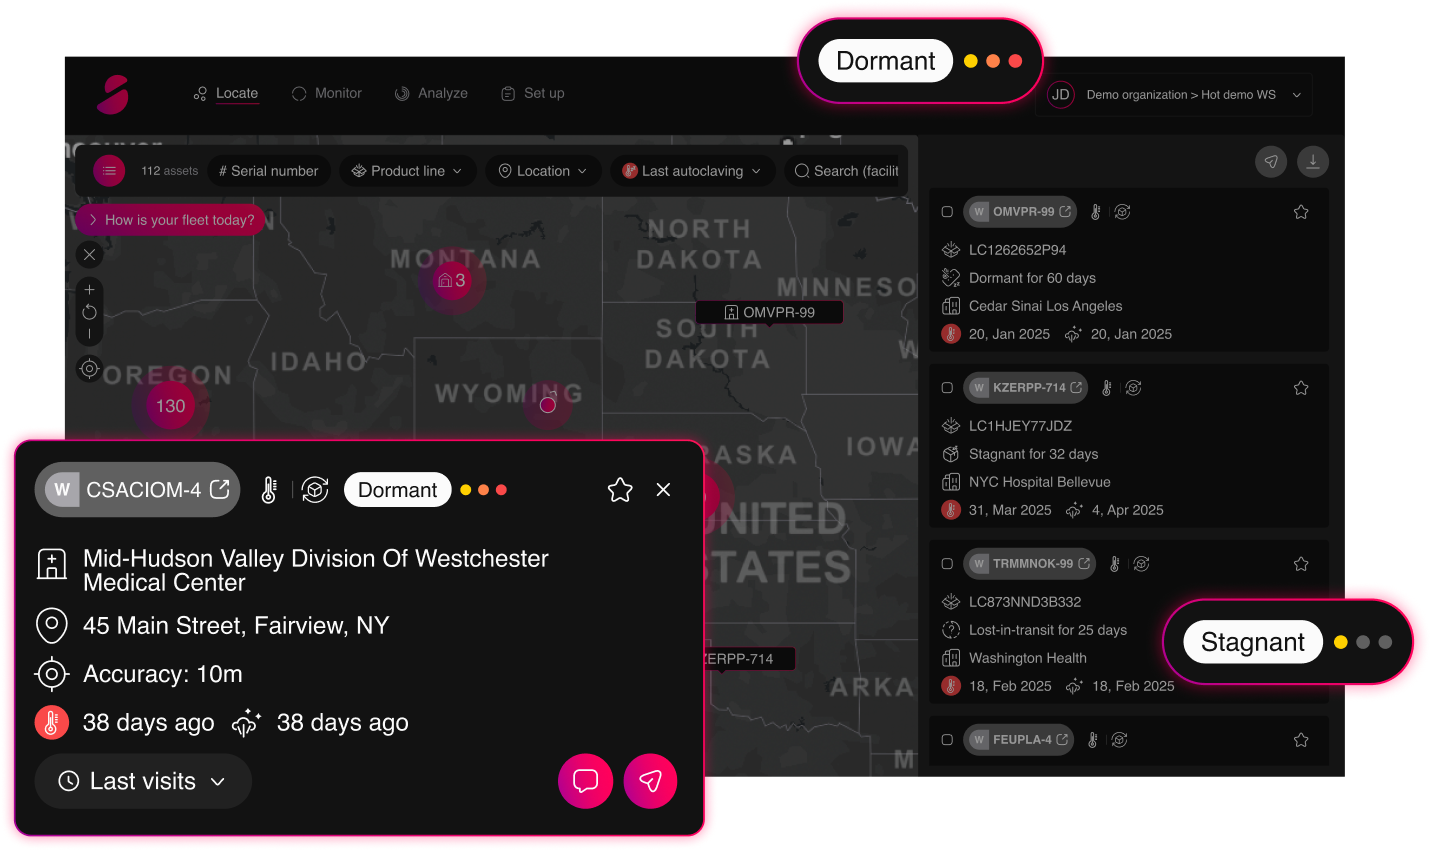
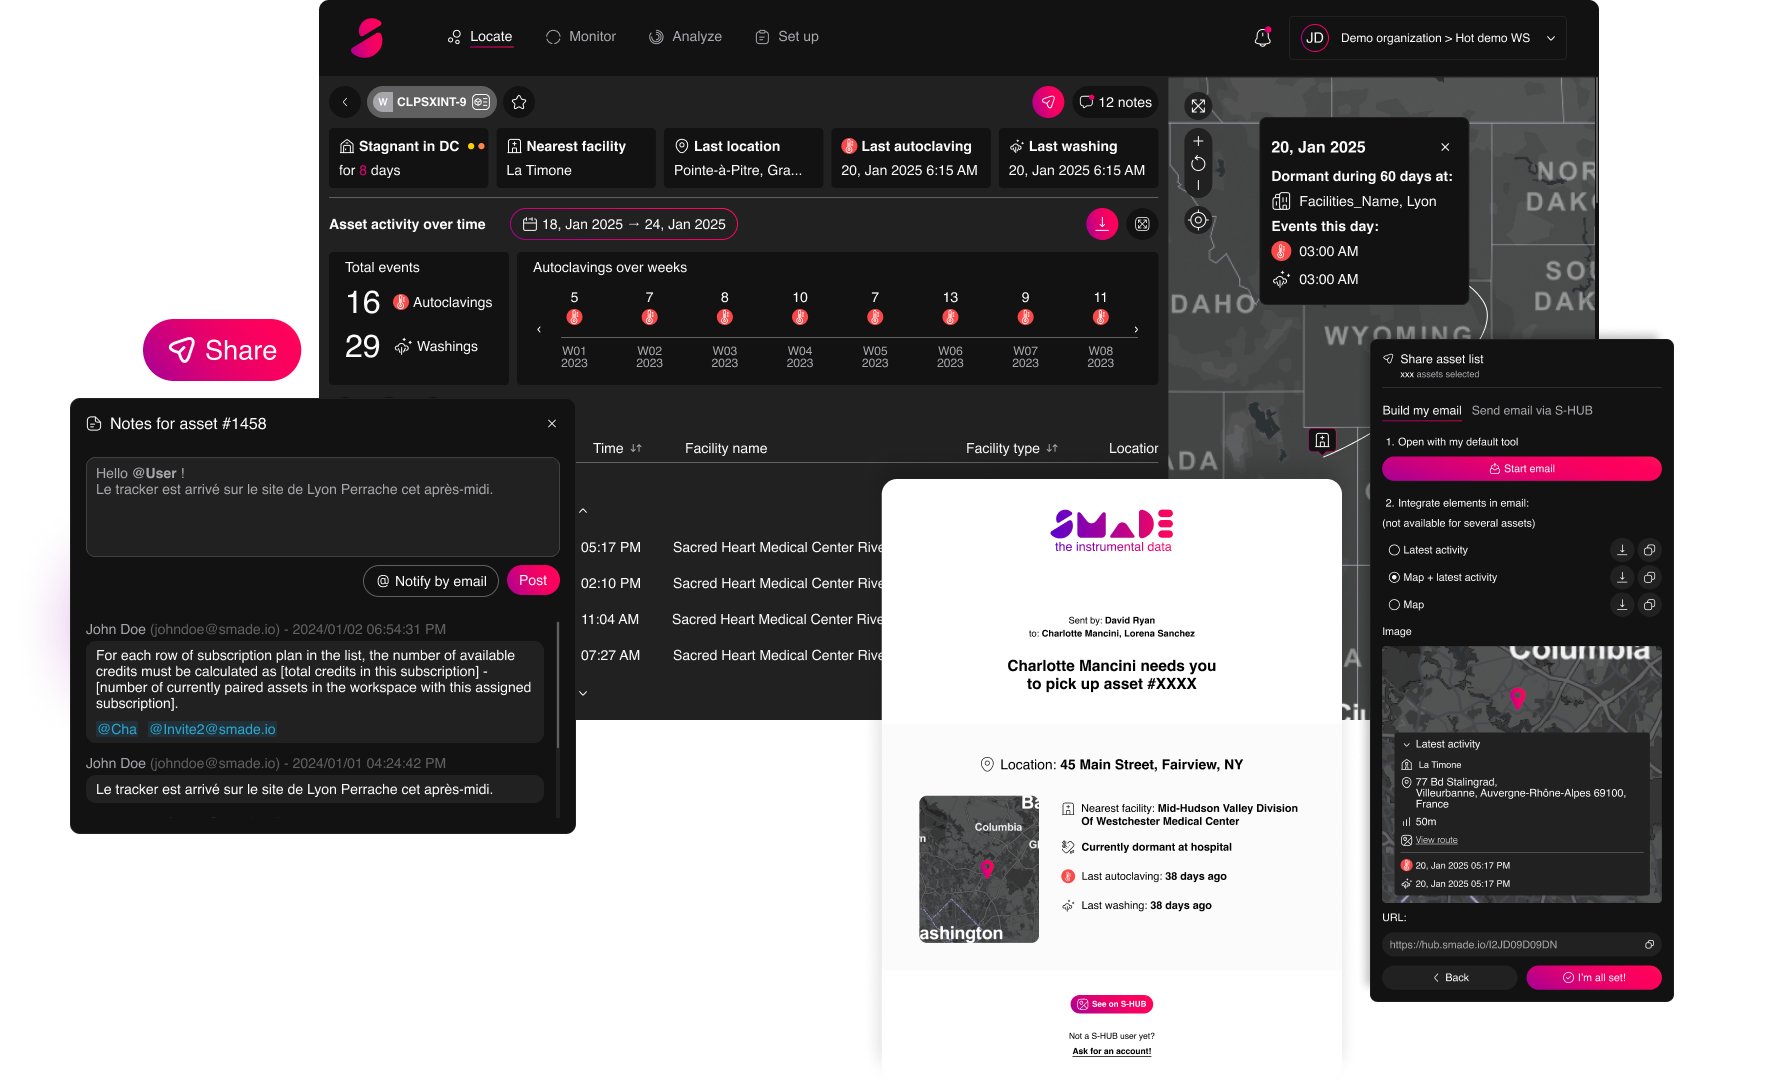
The enhanced “Fleet-Find Asset” experience makes locating and analyzing assets even more powerful. With continuous fleet monitoring and clear alert prioritization, S-HUB empowers you to anticipate critical situations and act with confidence, backed by reliable, real-time data.
- Exact asset location (DC, hospital, in transit)
- Facility name + detailed location context
- Active alerts (Dormant, Stagnant…)
- Severity level
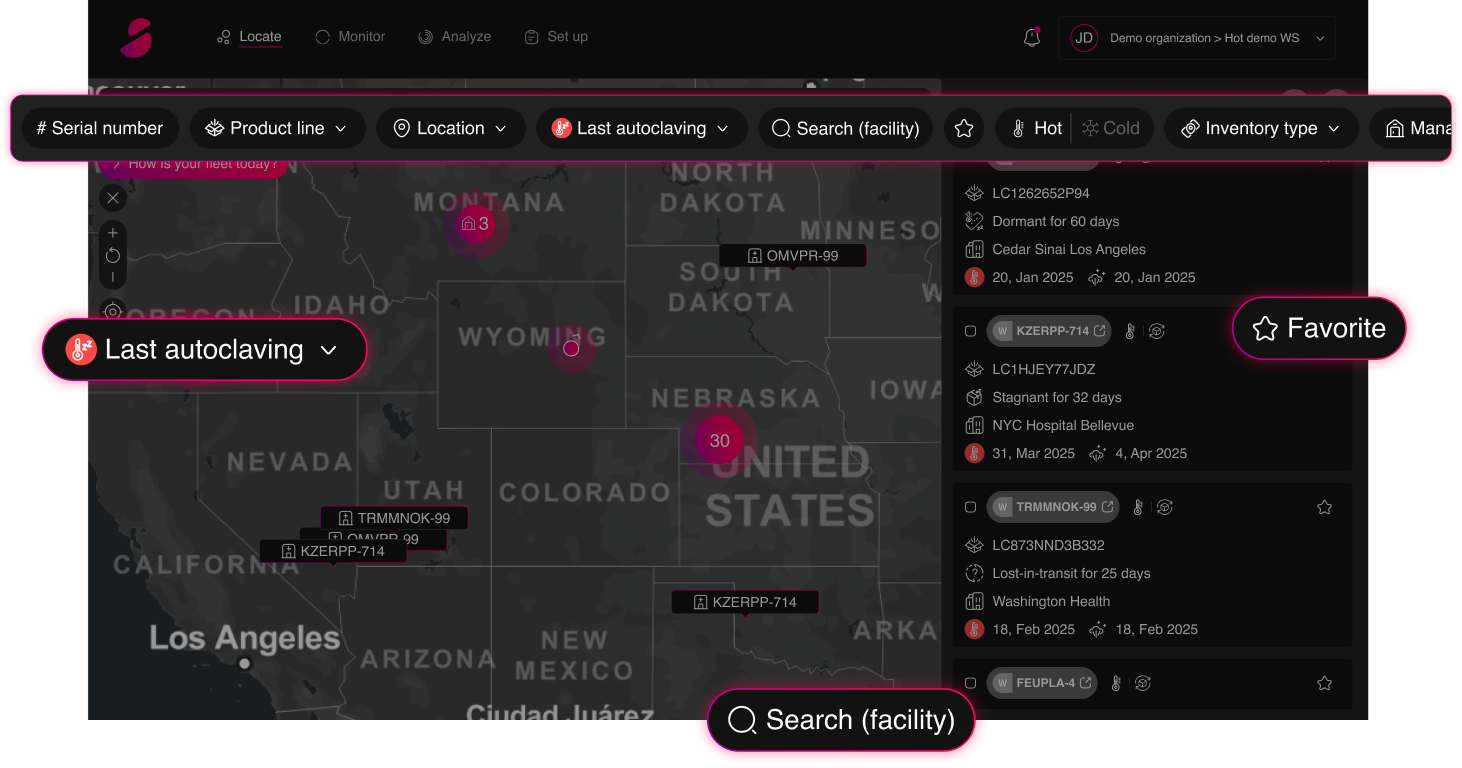
Smarter filters

Last autoclaving
Search by facility
Multi-criteria filters
The enhanced “Fleet-Find Asset” experience makes locating and analyzing assets even more powerful.
Single View
One asset.Complete visibility.
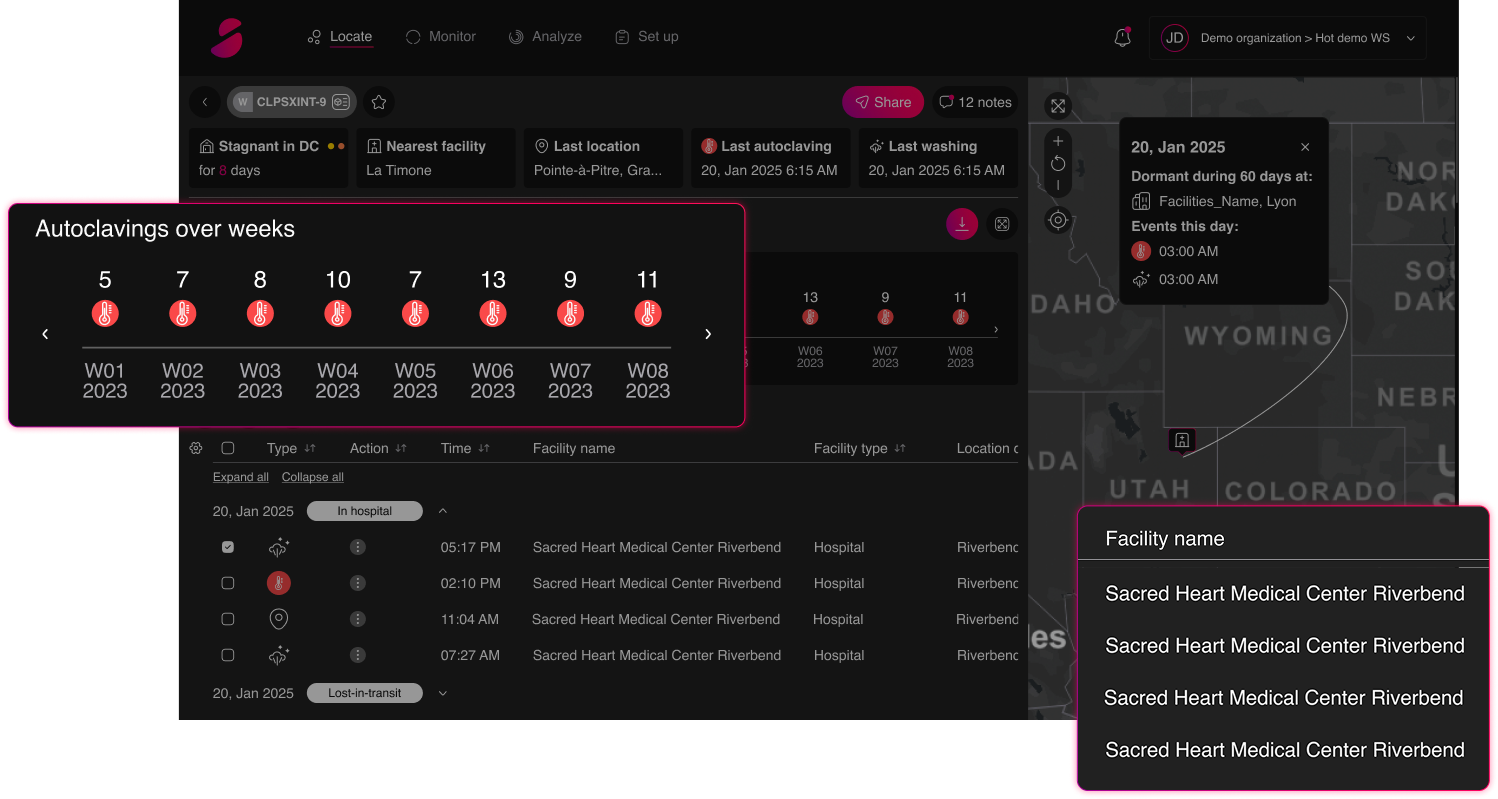
The Asset Single View gives you a 360° understanding of one specific asset instantly.
LATEST SNAPSHOT
- Latest activity snapshot
- Current alert + severity
- Nearest facility
- Last autoclaving / washing
TIMELINE & EVENTS
- Weekly timeline
- Event counters
- Time-range filtering
- Trajectory journal
Detect abnormal trajectories and risky transit points before they impact compliance or revenue.
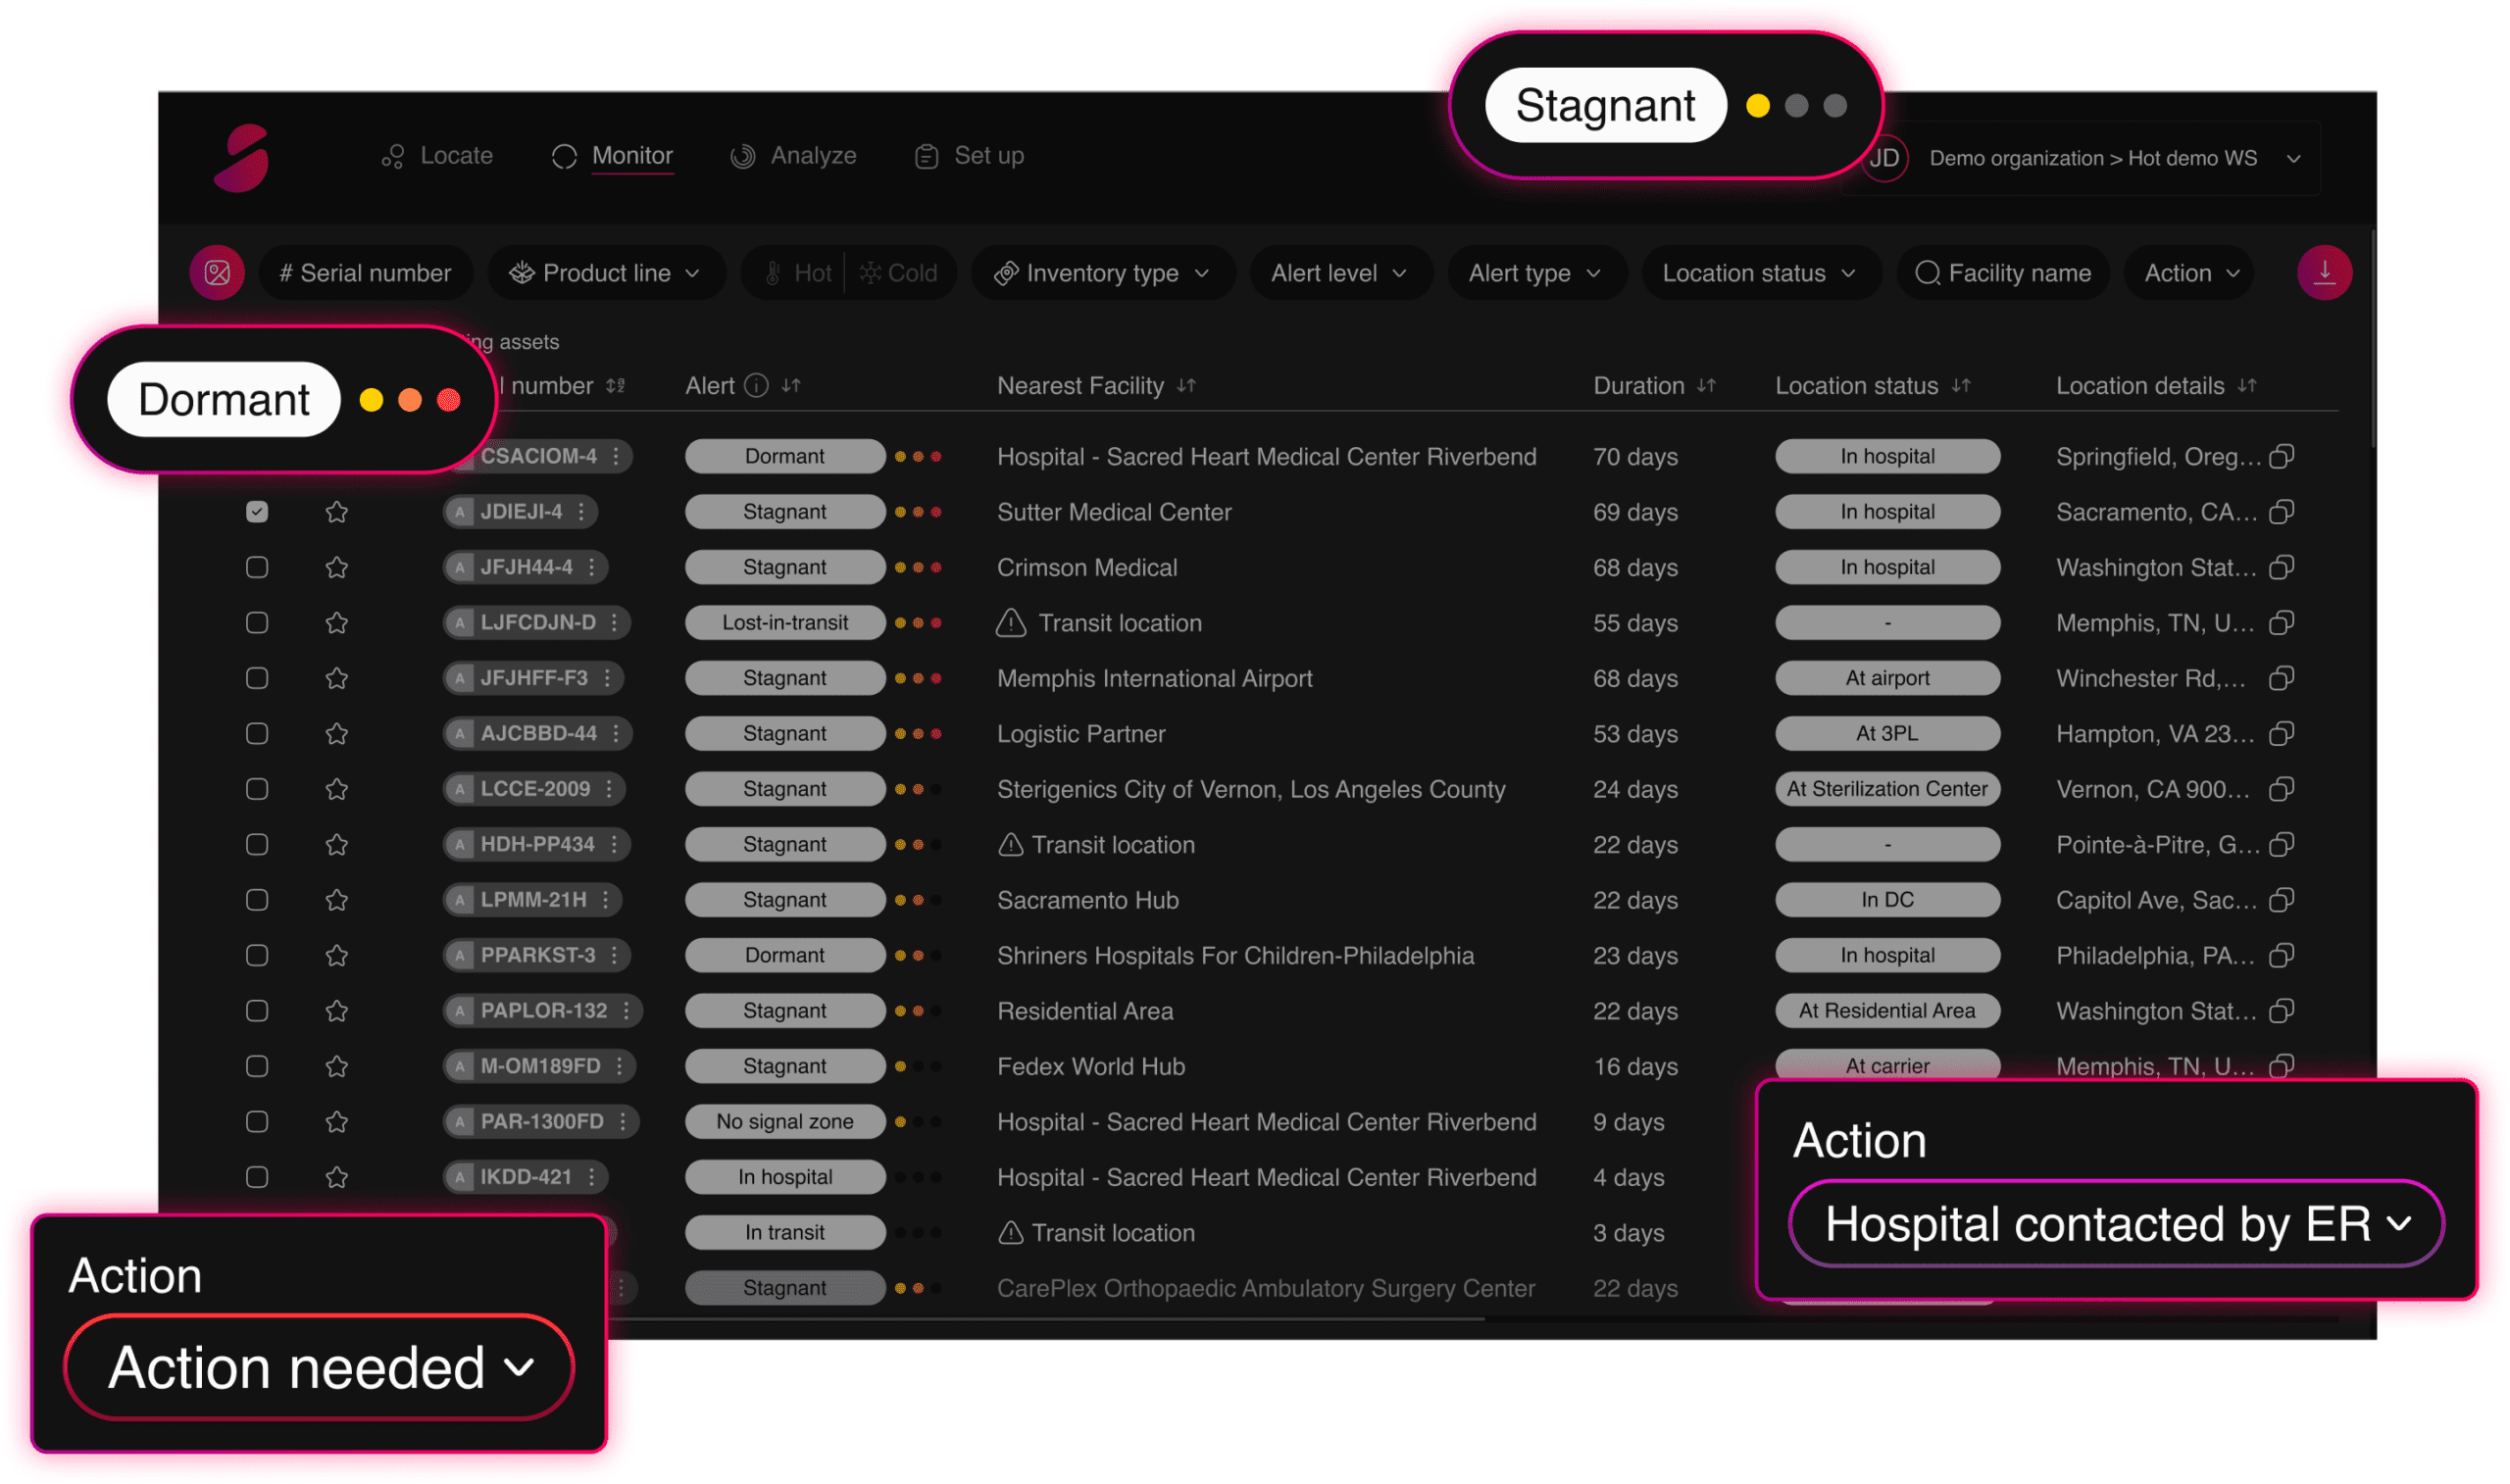
Monitor
From alerts to actionin one screen.
The Monitor page is your operational command center. Instantly identify assets that require attention: Dormant, Stagnant, Lost-in-transit, prioritized by severity so your team focuses on what truly matters. With smart filters (alert level, alert type, facility name, product line, inventory type, location status…), you can narrow down critical assets in seconds and detect bottlenecks across your fleet.
- Dormant, Stagnant, Lost-in-transit prioritized by severity
- Smart filters to isolate critical assets
- Full operational context per row
Engage, document, and track corrective actions directly from the dashboard.

Add notes

Export filtered lists

Share asset details
Track resolution progress
No spreadsheets. No guesswork. Just clear priorities and reduced idle inventory.
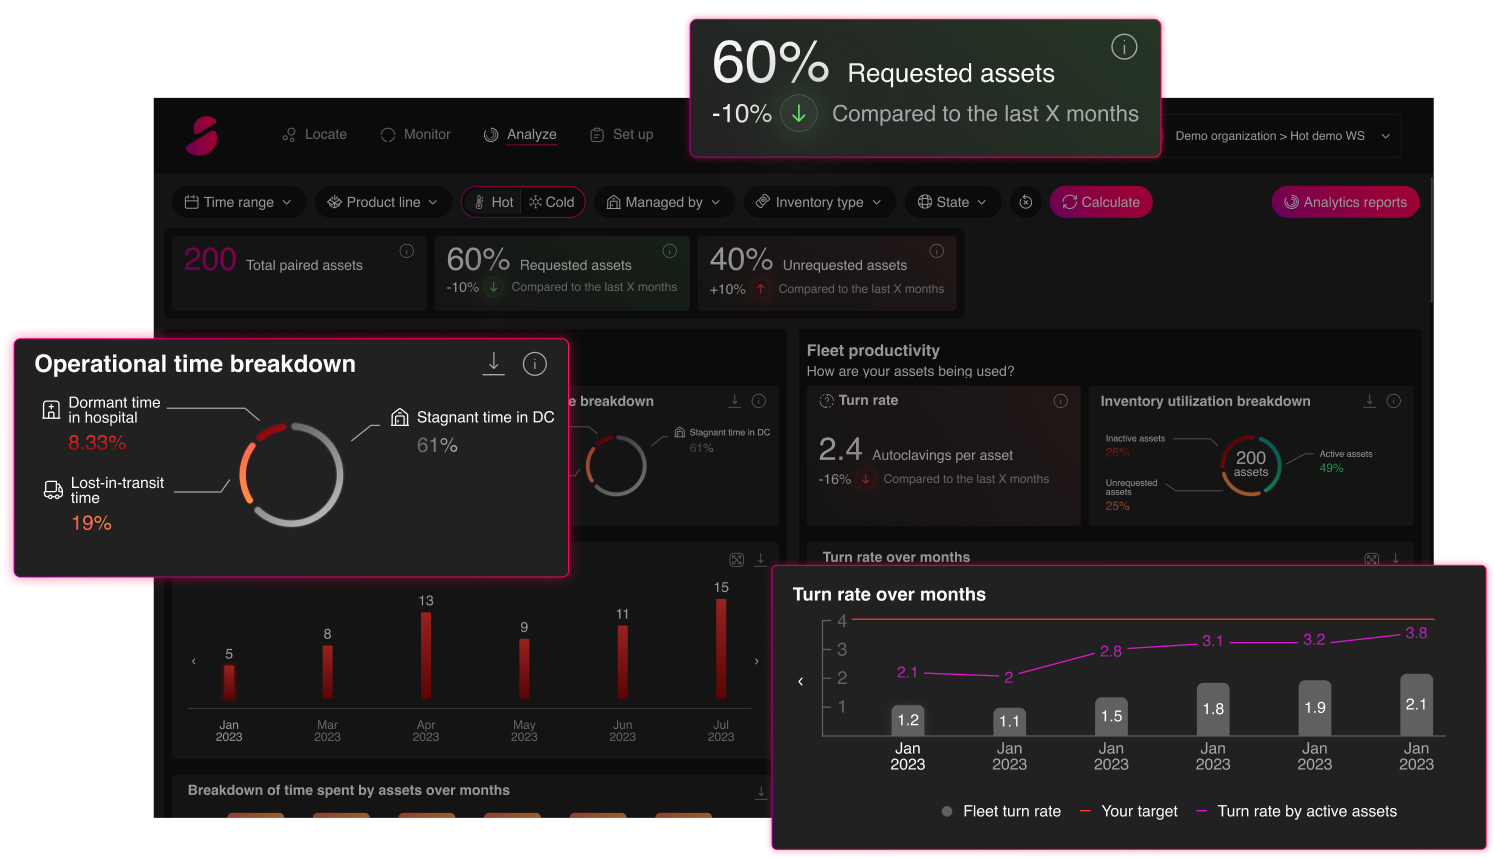
Analyze
Turn fleet data intomeasurable performance.
SMADE goes far beyond basic medical device tracking.
The Analyze dashboard transforms operational data into actionable KPIs that directly impact revenue,
productivity, and fleet strategy.
Interactive filters (time range, product line, asset type HOT/COLD, inventory type, geography…)
allow you to analyze performance by segment and uncover hidden inefficiencies.

Non-operational days
Turn Rate
Asset Availability Ratio

Requested vs Unrequested

Productivity Trends
From insight to optimization.
- Operational vs non-operational breakdown
- Inventory utilization analysis
- Monthly trend evolution
- Breakdown of time spent by assets over time
Clear financial visibility. Optimized fleet sizing. Higher revenue per asset.
Collaboration
Limitless and effortlesscollaboration.

Multi-user workspace

Role & permissions management

Real-time notes

One-click asset sharing
The power of collaboration translates into action.
Trusted by Market leaders

"SMADE helped us reduce lost assets by 25% in just 3 months while improving team efficiency."
— Operations Director, Healthcare Industry
"Centinel Spine wouldn't have performed the way it did in 2025 without SMADE."
— Eric Hill, Director of Asset Management, Centinel Spine
"Thanks to SMADE—and the diligent work of the trial pool team—we're seeing a clear positive financial impact."
— Lynsey VanSweden-Ott, Manager, Commercial Operations at Stryker
"By delivering precise, real‑time inventory location tracking, SMADE has reshaped our operations at VB Spine through accelerating logistics, improving case support, and elevating asset accuracy."
— Donald Huckaba, Director, Supply Chain Operations North, VB Spine
Real impact, measurable results
80%
Asset loss reduction
Clients recover lost equipment faster
and reduce replacement costs.
2.5x
Turn rate
Fleet rotation is significantly improved
with proactive monitoring.
5–10h
Teams spend less time searching and more time
on productive work.